| Include Page |
|---|
| ContentHeader |
|---|
| ContentHeader |
|---|
|
| Section |
|---|
| Column |
|---|
| Contents| Table of Contents |
|---|
| maxLevel | 4 |
|---|
| outline | true |
|---|
| indent | 20px |
|---|
| style | none |
|---|
| exclude | Contents |
|---|
|
|
|
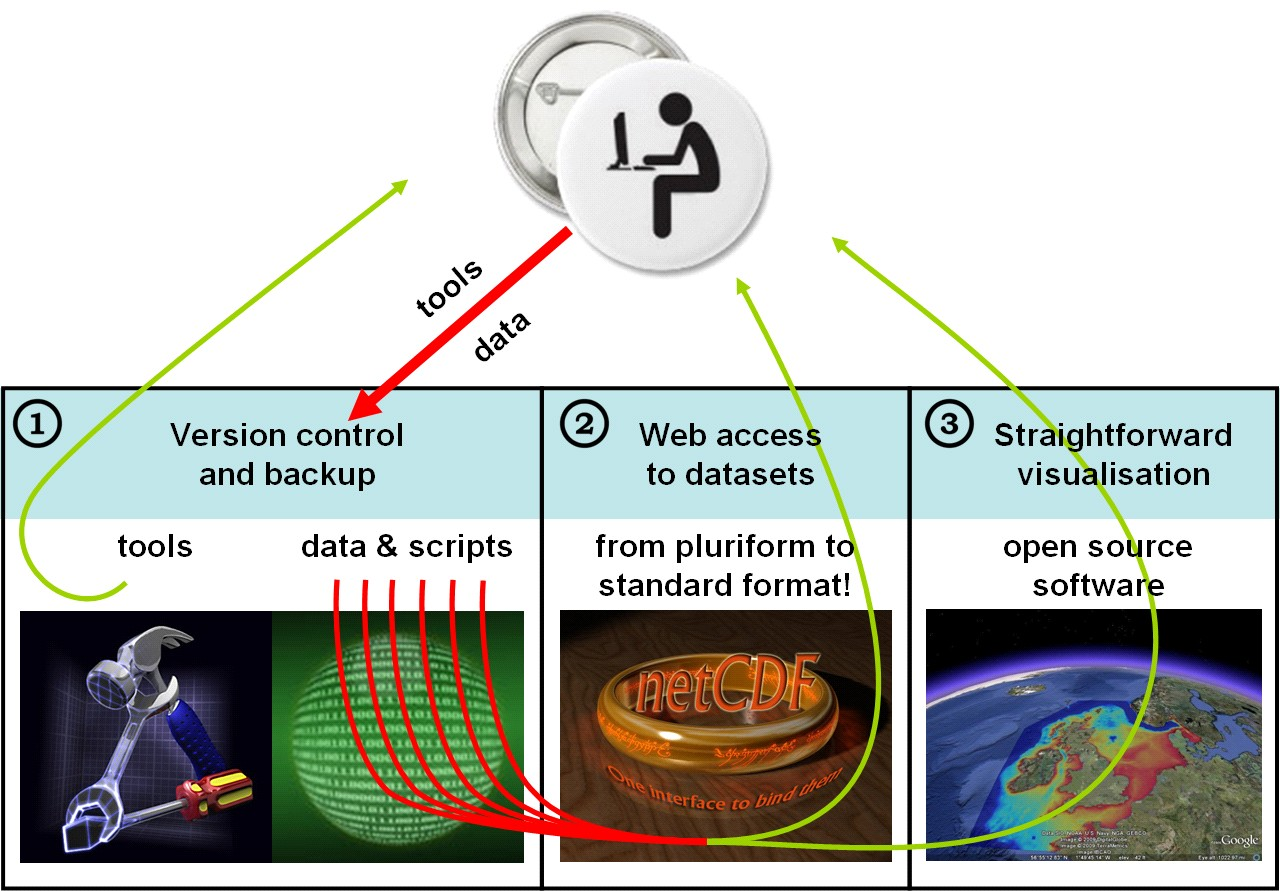
In this manual we describe how to use data from an OpenEarth system that consists of a Subverison repository, an OPeNDAP server and a server with Google Earth feeds.
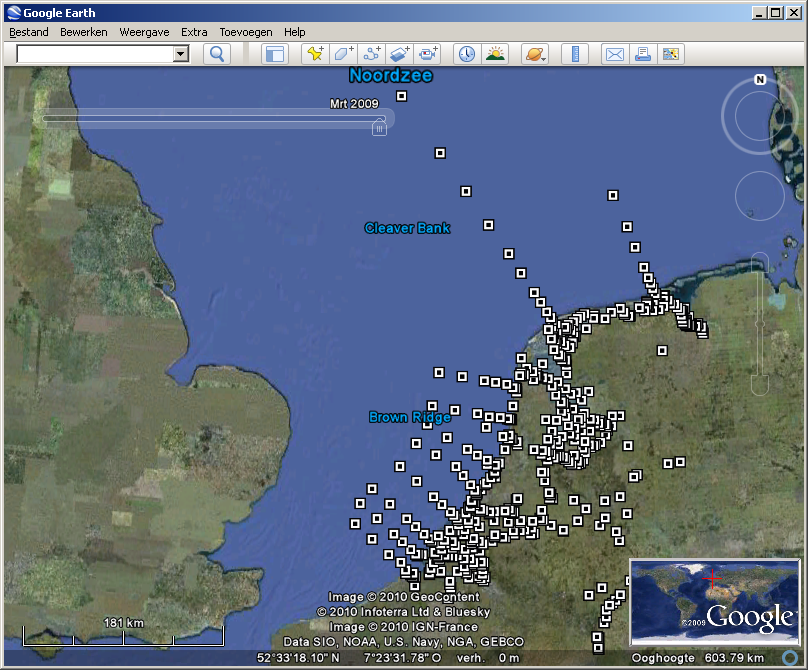
- Get the Google Earth file with the overview of the data from the kml server, e.g.:
- Maps
- Time series
- Rijkswaterstaat Waterbase (water levels, wave period/direction, water temperature, salinity, chlorofyll, suspended sediment)
- KNMI wind
- KNMI daily averaged meteo (wind, air temperature, sunshine, radiation, precipitation, air pressure, visibility, cloud cover, relative humidity, potential evapotransipration)
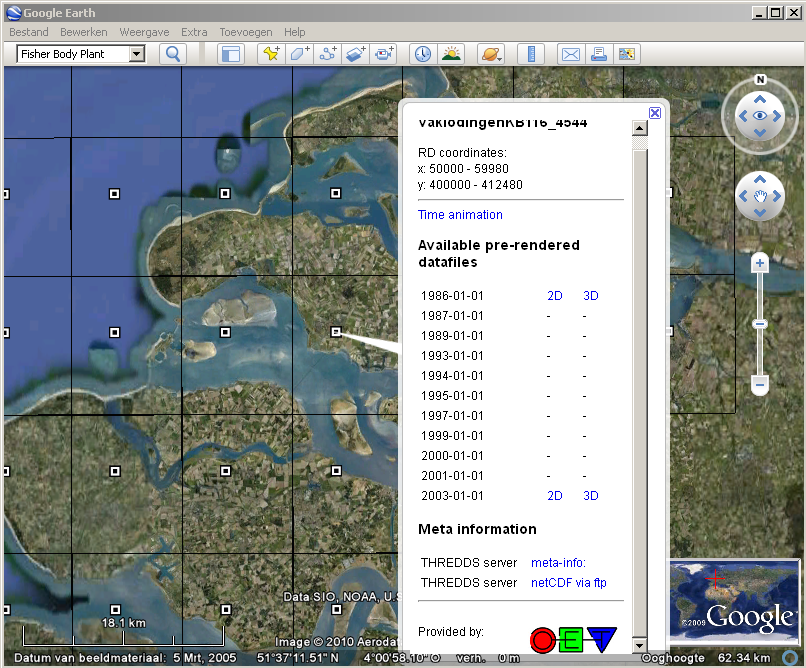
- Click on the placemark of the map or time serie you want to analyse, and then select the link THREDDS meta-info. Note: for the time series remember to drag the time ruler such that all times are available: drag the whole ruler first to the most recent data and then drag the left part of the ruler to the oldest date.

- In your browser the OPeNDAP meta-info page of the dataset will pop-up. You could also ave found this meta-info page by going down the OPeNDAP directory tree with a regular web brower staring at the top of the OPeNDAP three.

- Select all the in the box labeled Data URL.
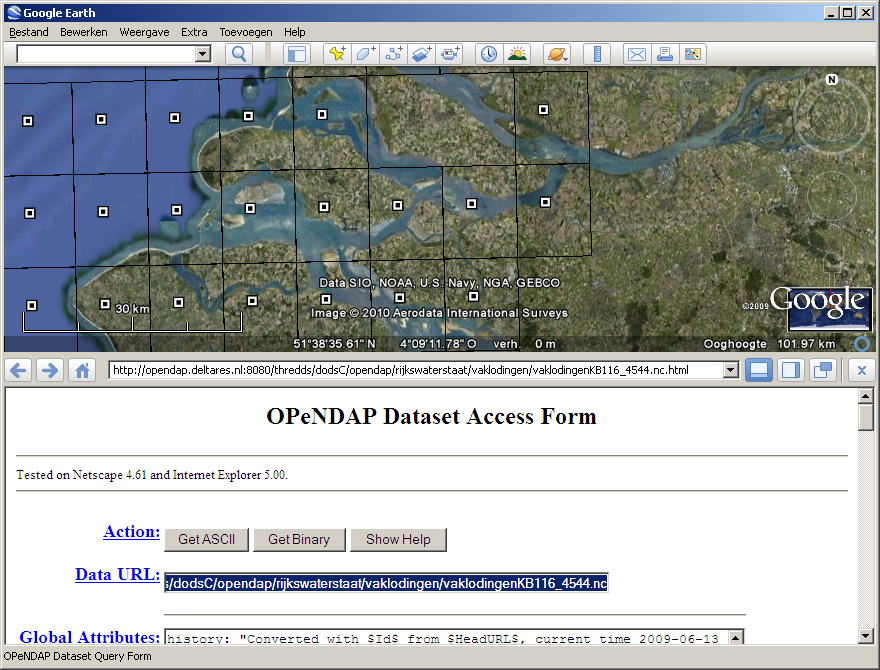

- The 'DataURL' string can be used (copy, paste) to read the data directly from the web into various software packages, e.g.:
Examples for these packages are given below:
| Include Page |
|---|
| OPeNDAP access with arcGis |
|---|
| OPeNDAP access with arcGis |
|---|
|
| Include Page |
|---|
| OPeNDAP access with ncBrowse |
|---|
| OPeNDAP access with ncBrowse |
|---|
|
| Include Page |
|---|
| OPeNDAP access with Matlab |
|---|
| OPeNDAP access with Matlab |
|---|
|
| Include Page |
|---|
| OPeNDAP access with python |
|---|
| OPeNDAP access with python |
|---|
|
| Include Page |
|---|
| OPeNDAP access with R |
|---|
| OPeNDAP access with R |
|---|
|
| Include Page |
|---|
| OPeNDAP access with Delft3D-Quickplot |
|---|
| OPeNDAP access with Delft3D-Quickplot |
|---|
|


