...
Below are two examples of a config and the resulting plot.
| Code Block |
|---|
| language | xml |
|---|
| title | dual axis example (click to expand) |
|---|
| linenumbers | true |
|---|
| collapse | true |
|---|
| <subplot>
<plotWeight>1</plotWeight>
<line>
<color>blue</color>
<axis>left</axis>
<timeSeriesSet>
<moduleInstanceId>ImportTelemetry</moduleInstanceId>
<valueType>scalar</valueType>
<parameterId>H.obs</parameterId>
<locationId>Hydro1</locationId>
<timeSeriesType>external historical</timeSeriesType>
<timeStep unit="minute" multiplier="15"/>
<relativeViewPeriod unit="hour" start="-36" end="36"/>
<readWriteMode>editing visible to all future task runs</readWriteMode>
</timeSeriesSet>
</line>
<line>
<color>blue</color>
<axis>left</axis>
<timeSeriesSet>
<moduleInstanceId>ImportTelemetry</moduleInstanceId>
<valueType>scalar</valueType>
<parameterId>H.rated</parameterId>
<locationId>Hydro3</locationId>
<timeSeriesType>external historical</timeSeriesType>
<timeStep unit="minute" multiplier="15"/>
<relativeViewPeriod unit="hour" start="-36" end="36"/>
<readWriteMode>editing visible to all future task runs</readWriteMode>
</timeSeriesSet>
</line>
<line>
<color>red</color>
<axis>right</axis>
<timeSeriesSet>
<moduleInstanceId>ImportTelemetry</moduleInstanceId>
<valueType>scalar</valueType>
<parameterId>Q.obs</parameterId>
<locationId>Hydro2</locationId>
<timeSeriesType>external historical</timeSeriesType>
<timeStep unit="minute" multiplier="15"/>
<relativeViewPeriod unit="hour" start="-36" end="36"/>
<readWriteMode>editing visible to all future task runs</readWriteMode>
</timeSeriesSet>
</line>
<line>
<color>red</color>
<axis>right</axis>
<timeSeriesSet>
<moduleInstanceId>ImportTelemetry</moduleInstanceId>
<valueType>scalar</valueType>
<parameterId>Q.rated</parameterId>
<locationId>Hydro4</locationId>
<timeSeriesType>external historical</timeSeriesType>
<timeStep unit="minute" multiplier="15"/>
<relativeViewPeriod unit="hour" start="-36" end="36"/>
<readWriteMode>editing visible to all future task runs</readWriteMode>
</timeSeriesSet>
</line>
</subplot>
|
|  Image Modified Image Modified
|
| Code Block |
|---|
| language | xml |
|---|
| title | dual axis with 2 parameterGroups example (click to expand) |
|---|
| linenumbers | true |
|---|
| collapse | true |
|---|
| <subplot>
<plotWeight>1</plotWeight>
<line>
<color>blue</color>
<axis>right</axis>
<timeSeriesSet>
<moduleInstanceId>ImportTelemetry</moduleInstanceId>
<valueType>scalar</valueType>
<parameterId>H.obs</parameterId>
<locationId>Hydro1</locationId>
<timeSeriesType>external historical</timeSeriesType>
<timeStep unit="minute" multiplier="15"/>
<relativeViewPeriod unit="hour" start="-36" end="36"/>
<readWriteMode>editing visible to all future task runs</readWriteMode>
</timeSeriesSet>
</line>
<line>
<color>red</color>
<timeSeriesSet>
<moduleInstanceId>ImportTelemetry</moduleInstanceId>
<valueType>scalar</valueType>
<parameterId>Q.obs</parameterId>
<locationId>Hydro2</locationId>
<timeSeriesType>external historical</timeSeriesType>
<timeStep unit="minute" multiplier="15"/>
<relativeViewPeriod unit="hour" start="-36" end="36"/>
<readWriteMode>editing visible to all future task runs</readWriteMode>
</timeSeriesSet>
</line>
</subplot>
|
| 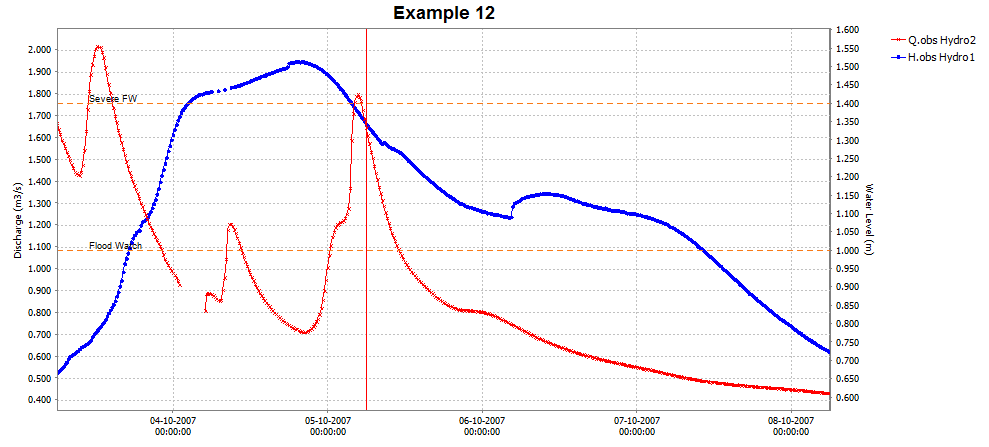 Image Modified Image Modified
Threshold line only for timeseries on the right y axis
|
Stage/discharge plots (dual y-axis plot)
...
Below an configuration and resulting plot
| Code Block |
|---|
| language | xml |
|---|
| title | ratingAxis example (click to expand) |
|---|
| linenumbers | true |
|---|
| collapse | true |
|---|
| <subplot>
<line>
<color>black</color>
<lineStyle>none</lineStyle>
<markerStyle>+</markerStyle>
<markerSize>3</markerSize>
<timeSeriesSet>
<moduleInstanceId>ImportTelemetry</moduleInstanceId>
<valueType>scalar</valueType>
<parameterId>Q.rated</parameterId>
<locationId>Hydro4</locationId>
<timeSeriesType>external historical</timeSeriesType>
<timeStep unit="minute" multiplier="15"/>
<relativeViewPeriod unit="hour" start="-36" end="36"/>
<readWriteMode>editing visible to all future task runs</readWriteMode>
</timeSeriesSet>
</line>
<line>
<color>black</color>
<lineStyle>solid</lineStyle>
<markerStyle>circle</markerStyle>
<markerSize>6</markerSize>
<axis>left</axis>
<ratingAxis>
<parameterGroupId>Water Level</parameterGroupId>
<transformationType>dischargeStage</transformationType>
</ratingAxis>
<timeSeriesSet>
<moduleInstanceId>ImportTelemetry</moduleInstanceId>
<valueType>scalar</valueType>
<parameterId>Q.obs</parameterId>
<locationId>Hydro2</locationId>
<timeSeriesType>external historical</timeSeriesType>
<timeStep unit="minute" multiplier="15"/>
<relativeViewPeriod unit="hour" start="-36" end="36"/>
<readWriteMode>editing visible to all future task runs</readWriteMode>
</timeSeriesSet>
</line>
</subplot>
|
|  Image Modified Image Modified
|
timeSeriesSet
chainageLocationSetId
...
- <showAsScatterPlot>: TimeSeries display will be replaced with a scatterplot
- <addInteractionScatterPlot>: you can turn on an extra scatterplot that is displayed next to the original time series.. The interaction scatterplot
- This button has to be enabled in the TimeSeriesDisplayConfig.xml buttonSettings
.- with <showInteractionScatterPlot visible="true"/>
With the elements <xAxisRange> and <yAxisRange> the range of the x and y axis can be defined.
...