Flood Mapping Module
This document describes the configuration and use of the Flood Mapping module. While this module is distributed as a part of DELFT-FEWS, it can potentially be run outside of DELFT-FEWS as well.
The role of the flood mapping module is to provide a projection of the results of a one-dimensional hydrodynamic module as a 2D flood surface map. The result of the module can be displayed using the grid display, which is a part of DELFT-FEWS. The results can be equally exported to as standard GIS interchange files using for example the ESRI Shape file and or ASC grid file formats.
Setting up a flood mapping module within DELFT-FEWS is equivalent to creating a new model. As such, specific requirements are posed on data required in setting up the module, as well as some steps to make this data available to the module in the correct way.
Data requirements
The interpolated flood map is derived on the basis of the results of a one-dimensional hydrodynamic model. Effectively the results of the model, given at the water level calculation points, are geo-referenced and subsequently interpolated to form a water level surface. The primary data requirements are therefore those that link the 1D model to a 2D location. In some cases a careful interpretation of how the 1D model is represented in two dimensions must be given, and a good understanding of the assumptions made in establishing the 1D hydrodynamic model for the reach in question is prerequisite.
Georeferenced cross sections
The method used to link the 1D model results and a location on the map, is a datasets giving the coordinates of each cross section point. The 1D model calculates levels at these points, and, using the locations given in this datasetm all information required for projecting the results in space is available.
Important to note is the assumption made in 1D modelling that the water level calculated at each grid point in the model is valid at all locations on the cross section. The georeferenced points available should therefore not only include one point per cross section (e.g. at the centre of the river), but multiple points describing how the cross section crosses the floodplain and the main channel. Each of these points must carry the same identification lable, and will be assigned the same water level calculated in the 1D model (see the example in Figure 160). For flood storages areas, where the 1D model calculates a single water level, the outline of this area should be represented by a suitable number of points (an example is given in Figure 161).

Figure 160 Example of geo-referenced cross sections. Triangles indicate geo-referenced points. Empty circles (see the dotted selection line) show points belonging to one cross section
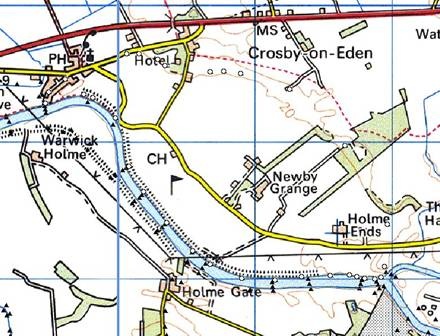
Figure 161 Example of a geo-referenced flood storage basin. Triangles indicate geo-referenced points. Empty circles (see the dotted selection line) show points belonging to a storage basin for which the 1D model provides one calculated water level.
Digital Elevation Model
A digital elevation model of the reach in question should be available. This elevation model must be of sufficient extent and of sufficient resolution. Generally these can be obtained from for example laser altimetry (LiDAR) survey data. In this case the resolution may be extremely high, without necessarily adding to the accuracy in the final flood map. Run times and memory usage of the flood map module are quadratically proportional to the resolution. A resolution of e.g. 10m by 10m is often sufficient, and source data may need to be aggregated prior to use in the flood mapping module. (see data preparation).
River Axis
The flood mapping module establishes a final flood map on the basis of flood areas with a contiguous connection with the main river channel. A shape file representing this river axis (normally a line) is required. Note that for storage basins with an embabnkment around the edge, this contigous connection to the main channel may be a problem. As a consequence the complete storage area should be included in the river axis theme.

Figure 162 River axis map. These are indicated by the hatched surfaces.
TIFF background maps
Although not strictly used by the flood mapping module, TIFF layers of the reach at sufficient resolution (e.g. 1:10000, or 1:25000) arte required to check consistency of data and avoid problems such as positional errors etc.
Data preparation
Prior to application of the flood mapping module the source data will need to be prepared/reformatted to make this suitable.
Digital Elevation Model
The digital elevation modle for the reach in question will need to be checked on consistency and made available at a suitable resolution. Using too fine a resolution will result in excessive run times of the module and/or memory problems. If the source model is available at too fine a resolution then this can be aggregated. When aggregating the model, explicit consideration should be given to line elements such as embankments, roads etc. Where these are present in the floodplain a different aggregation strategy should be used. For most areas an averaging aggregation strategy should be used, while for line elements a strategy should be used where the aggregated cell contains the maximum value of the underlying cells. IF available, levels along line elements can be forced in the aggregated elevation model.
The resulting flood map will return missing values where the digital elevation model contains missing values. These are often seen in the main channel in Laser Altimetry derived elevation models. These should be filled in prior to running the flood mapping module. Technbiques such as spatial interpolation or nearest neighbour filling can be used to remove these values. The resulting elevation model should always be checked afterwards. Once complete the digital elevation model should be saved as an ARC-INFO format ASCII grid file
Flood map sections
The flood mapping module will interpolate a flood surface map for the reach in a set of independent sections. A flood mapping section is an area considered to be geographically independent (in water level) from other sections in the flood map. There may be dependence through the structure of the 1D model. In fact, the section map makes the structure of the 1D model explicit. It defines which part of the final flood map is influenced by which part of the 1D model. This is the most apparent at a confluence, where for the piece of land between the two tributaries a decision must be made from whci tributary each cell is to be inundated. This decision was actually already taken when establishing the structure and cross sections of the 1D model. An independent section must also be defined for storage basins for which a level is calculated in the 1D model. Each section is number consequitively by a unique index, starting at zero. This section map is best made as a polygon theme first, and once completed should be saved as an ARC-INFO format ASCII grid file at the same resolution and extent as the digital elevation model.

Figure 163 Flood map sections. These are number consequetively, starting at 0.
River Axis map
The river axis map should also be saved as an ARC-INFO format ASCII grid file at the same resolution and extent as the digital elevation model. If this theme is a line theme then it is good practice to buffer the line with a distance equal to the grid cell resolution prior to saving as a grid file. The value of the grid cells is not important, but grid cells not in the river axis map should be saved as missing values.
Georeferenced points
The list of georeferenced points are saved to an XML file. The points for each of the sections in the flood map section coverage is defined in one group. When creating a flood map

Figure 164 Elements of the geoReference points configuration.
geoDatum
Coordinate system used in defining the points. For an enumeration of available coordinate systems see Appendix B.
geoReferenceData
Definition of a set of points falling in a particular section. For each of the sections (see above) the points to be considered when establishing the flood map for that section should be defined in separate groups.
Attributes;
- label : label of the points in this group. Each label must be associated with a label in the longitudinal profile/time series used to create the flood map.
mapSectionId
Id of the flood map section. This should comply with the section Id's in the Flood Map Section theme. The sections given in this file are those for which a floodmap is established. If the section id is not included in this file then a flood map will not be interpolated for that section id.point
Definition of a point falling within the current section and to be allocated a calculated level associated with the current label.
Attributes;
- x : x-coordinate of point (Easting)
- y : y-coordinate of point (Northing)
Example of a set of geoReference points

Configuring the Flood Mapping Module
Once the data has been prepared, the flood map module itself can be configured. This is again configured through an XML file. The flood map module can be applied in a number of different ways.
1. Input in the form of a set of time series, one for each calculation point in a river branch; output as a longitudinal profile time series.
2. Input in the form of a set of time series, one for each calculation point in a river branch; output as a flood map.
3. Input in the form of a longitudinal profile time series; output as a flood map.
When used to create flood maps, outputs can be defined to be returned in a number of ways;
1. As a time series of grids, showing distributed depth data for each time set,
2. As a single grid, showing the maximum distributed flood depth,
3. As a polygon of the maximum flood extent. This polygon can be formatted both as a Published Interface Polygon file, and as an ESRI compatible Shape file.

Figure 165 Elements of the flood map module configuration
floodMapdirectories
Root element for definition of directories used in module
rootDir
Root directory for the module. All other directories can be defined relative to this root dir.
workDir
Working directory when running the module
outputDir
Output directory for resulting flood maps and publsished Interface FloodMap Stack file. This is the directory from which the General Adapter running the flood map should be configured to read the maps.
inputDir
Input directory for time series / longitudinal profile for which a flood map is to be calculated. This is the directory where the General Adapter running the flood map should be configured to write the data.
pcrDir
Optional location for PCRaster engine used in deriving flood maps. Required when using PC Raster executable (DLL is in the FEWS Bin directory). For 64 bit support the PCRaster engine needs to be installed manually. See: PCRaster
floodMapSet
Root element for the definition of activities to be run for the flood map module.

Figure 166 Elements of the flood map configuration
geoDatum
Definition of the coordinate system used in flood mapping. See Appendix B for enumeration of available options.
longitudinalProfile
Root element to be used when requesting output from the flood map module as a longitudinal profile.
branchFile
Published Interface formatted file with the calculation points to be included in the profile. Labels (id's) at the locations should co-incide with the labels (id's) in the time series.
timeSeriesFile
Time series inputs. These should be given for each location to be considered in the profile. Note this can be used either to create a profile for use in flood mapping in an ensuing step, or to create a profile for visualisation using the longitudinal profile display.
profileFile
Name of the output longitidunal profile. For each label where a match is found between the time series and the branch file data is retained in this output file.
floodExtentMap
Root element to be used when using the module to create a flood extent map.
input
Root element for defining inputs to flood extent map.

Figure 167 Elements of the configuration of inputs from the flood map.
profileFile
Name of the longitudinal profile file (Published Interface XML format) if this is used as an input (may have been created in the previous step). The labels in the profile file should coincide with the labels in the geoReference points file.
timeSeriesFile
Name of the time series file (Published Interface XML format) if this is used as an input. The labels in the time series file should coincide with the labels in the geoReference points file.
asciiDemFile
Name of the digital elevation model. This must be in the Arc-info ASCII grid format.
asciiAxisFile
Name of the axis file. This must be in the Arc-info ASCII grid format.
asciiMapSectionFile
Name of the map sections file. This must be in the Arc-info ASCII grid format.
geoReferenceFile
Name of the published Interface XML file with the geo-referenced point data.
interpolationOptions
Options to be used in interpolation. See the interpolation module (Module Configuration) for details. The flood map module should be defined to use bi-linear interpolation.
The options in this section should be set as;
<interpolationOptions>
<interpolationOption>bilinear</interpolationOption>
<interpolationType>seriesgeneration</interpolationType>
<valueOption>normal</valueOption>
</interpolationOptions>
pcrScript
Name of the PC Raster (GIS) script to run when creating the flood maps. This item should be set as;
For PCRaster Script (Old Version)
<pcrScript>
	<pcrScriptFile>pcr_flood_clump.mod</pcrScriptFile>
</pcrScript>
See attached pcr_flood_clump.mod
For PCRaster XML Script (PCRaster 2008 Version compatible)
<pcrScript>
	<pcrScriptXMLFile>pcrscript.xml</pcrScriptXMLFile
</pcrScript>
See attached pcrscript.xml
output
Root element for definition of the required output. Different output options may be selected. Multiple options may also be defined.

Figure 168 Elements of the flood map output configuration
outputOption
Definition of an outpus block, requesting the flood map module to return the given output type. Enumaration of available options includes;
- pertime : for output as a time series of flood maps
- maximumextent : for output of the maximum flood extent as a grid file.
- contour : for output of the maximum flood extent map as a contour map
asciiGrid
Root element for requesting output as a time series of ASCII grid fles.pcrGrid
Root element for requesting output as a time series of PC raster grid fles.filename
Filename of output grid. Note that the time step number is appended E.g for time step 7 and filename "asc" this becomes "asc0000.001".mapStackFileName
File name for the Published Interface XML format file used by the general adapter for importing the resulting flood map.contour
Root element for requesting output as a time series of contours (polygon files). This option can only be used for creating a maximum flood extent.filename
Filename of output polygon file. Note that if this is given with a suffix "xml" then this is a Published Interface formatted XML file. If it is "shp" then the output will be as an ESRI shape file.numberOfCountours
Number of contours in the resulting map- at least 1 should be given.Running the flood map module
The flood map module is run within DELFT-FEWS through the General Adapter. Details on the configuration options can be found in the Module Configuration section. It is important to correctly configure the Import/Output directories correctly to allow the module to work correctly.
An example of the General Adapter configuration is given below. Note a Java Class is run (this is the flood map module) with the name of the XML file configuring the module as an argument. The other items in the General Adapter configuration are for defining data to export to and data to import from the Flood Map module.
