OpenEarth Google Earth feeds:
Rijkswaterstaat |
|
|
|---|---|---|
|
The bathymetry of the entire Dutch coast, 1928 to present. |
|
|
The bathymetry of the entire Dutch coast, 1928 to present. |
|
|
The bathymetry of the entire Dutch dune and foreshore and dry areas of the WaddenSea, 1996 to present |
|
|
Bathymetry profiles of the entire Dutch dune and foreshore, 1965 to present |
|
|
Gridded bathymetry of the entire Dutch dune and foreshore, 1965 to present |
|
|
Coastal suppletions with meta-data, 1952 to present |
|
|
Mud content in samples of Wadden sea bed |
|
|
Location standpalen en evolution three coastline |
|
|
Locations of measurement stations of time series parameters (water levels, discharges, salinity, temperature, chlorophyll, nutrients, wave parameters) |
|
TNO |
|
|
|
Digital elevation model of the Ntehrlands. |
|
|
Grain size maps of Dutch Continental Shelf. |
|
KNMI |
|
|
|
Locations of measurement stations of time series of wind speed and diection |
|
|
Locations of measurement stations of time series of daily averaged meteo (rainfall, sunshine, cloudiness, etc.) |
|
|
Example satellite images series of SST on the North Sea (may 1990) |
|
Deltares |
|
|
|
Animation of the measured winds during Katrina, and the associated water level set up. |
|
|
Animation of water movement during a tidal cycle in an estuary. |
|
|
3D contour plot of Westerschelde Estuary |
|
|
All other kml files, note that some of the bigger files might need a bit of time to load, just be patient. |
External Google Earth feeds:
- OnEarth by NASA.
- edugis for teachers and pupils
- AGU: Geo-Visualization with Virtual Globes (AGU,session)
- Google Geo blogs: Lat Long, Google Geo Developers, MAPS API
- NIOZ in Google Earth (kml).
- Rijkswaterstaat operational water level forecasts from MATROOS (Google Earth, Google maps).
- http://www.gearthblog.com/
- and the Google Earth mapping service TM screenshots created with
...
... OpenEarth
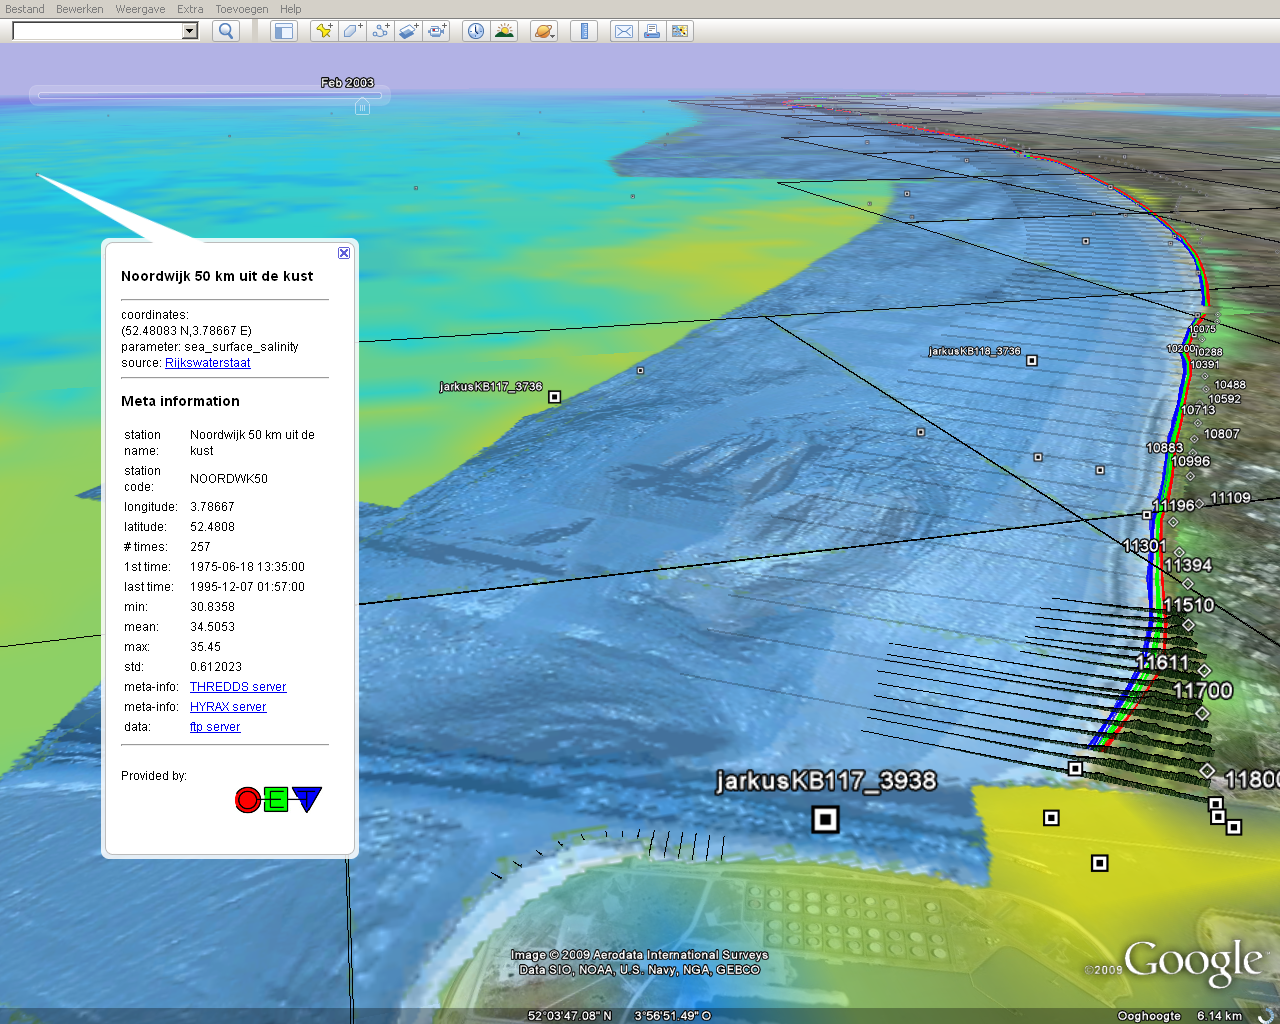
OpenEarthTools contains a toolbox to visualize a plethora of data in a plethora of styles in Google Earth TM mapping service.The HOME of this wiki displays a random selection from data from the OpenEarth OPeNDAP server visualized in Google Earth. The image below shows 6 different data types in one screenshot.
- Jarkus profiles (selection shown)
- Jarkus grids (overview shown)
- Vaklodingen grids
- KNMI NOAA Sea Surface Temperature images
- Strandlijnen en strandpalen
- Timeseries from Rijkswaterstaat and KNMI (salinity shown) with deep weblinks to data and meta-data