Results are visualized directly in a web-based viewer. This viewer is easy to use and suitable for desktops, tablets, and smartphones. Measurements for specific user groups are also visualized in the Delta Data Viewer. The flexible design makes it easy to develop specific views for certain catchment areas and/or user groups. The data can be visualized in different ways and the user can choose between different background maps.
By using the Aquality login functionality you can send in private measurements that are not included in the public database. See the login manual for instructions.
| Web-based viewer (freely available) | Delta Data Viewer (for registered users) |
|---|---|
 |  |
Examples
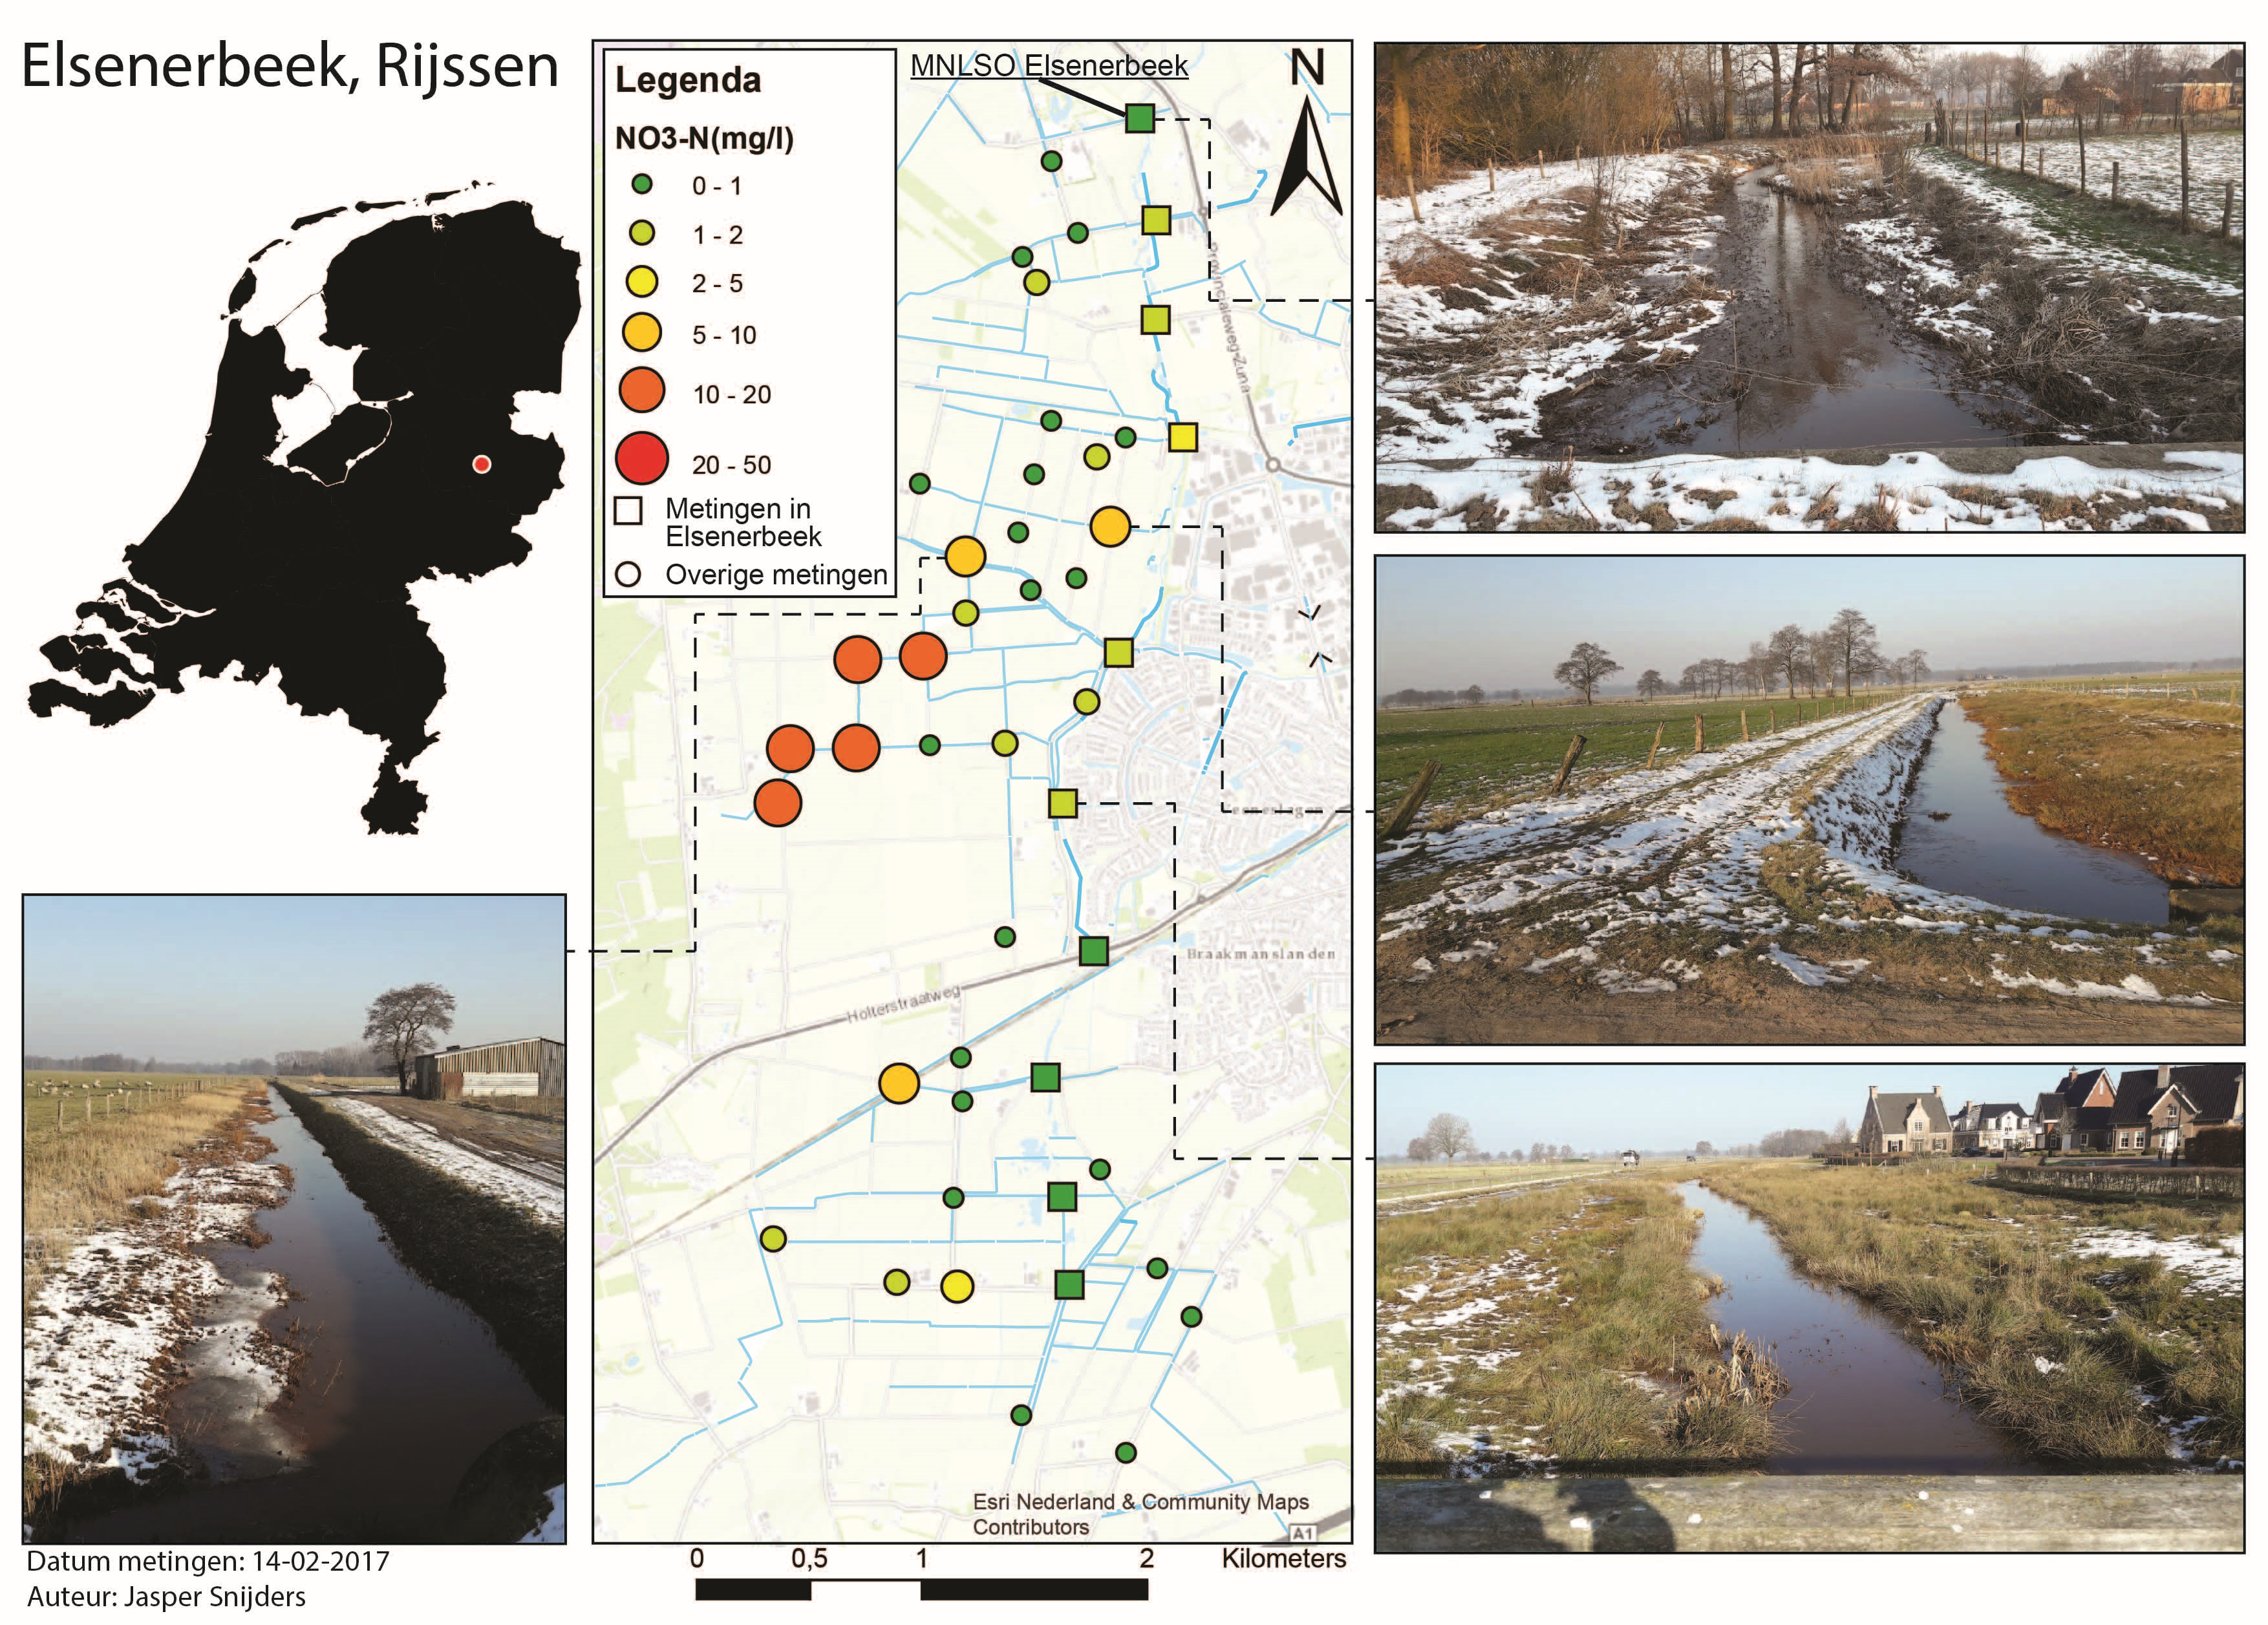
Hotspot in the Elsener brook On February 14th 2017 a routing was done in the Elsener brook, West of Rijssen. In the main brook itself no very high nitrate concentrations were found. Also, most contributing ditches showed low concentrations. One farm ditch however, appeared to have much higher nitrate concentrations compared to the other ditches. This ditch drained a small sub catchment with a couple of farms, which probably caused the high nitrate concentrations.
Click on the map to enlarge | |
| 1 | Route of effluent from the sewage treatment facility in Zeist via Bunnik and the Kromme Rijn River to Utrecht Search for the source of the high nitrate concentrations at the measurement location at the bottom left in October 2016 . The Nitrate app (now: Aquality App) is used to find the source and the route of the sewage treatment plant (STP) discharged through Zeist (green arrow) via Bunnik to the Kromme Rijn River.
|
| 3 | Nature en glasshouse horticulture in Delfgauw On December 22th 2016, a Nitrate App (now: Aquality App) routing was done in Delfgauw in the West of The Netherlands. High nitrate concentrations were found in the ditches around the glasshouses. Low nitrate concentrations were measured in the rest of the catchment, which is a nature reserve. The map with the nitrate measurements convinced the representative of the glasshouse owners that the high nitrate concentrations in the area were not caused by the birds in the nature reserve.
|
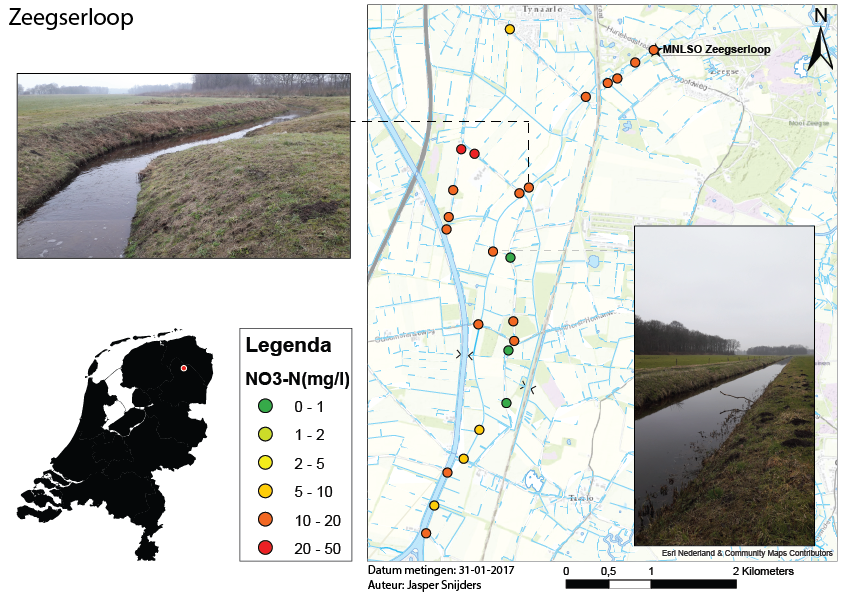
| 4 | Manure processing factory largest nitrate source in the Zeegserloop brook. On January 31th, a Nitrate App (now: Aquality App) routing was done in the agricultural Zeegserloop catchment. The nitrate concentrations exceeded 10 mg/l NO3-N at many locations throughout the catchment. A clear nitrate hotspot was found in Eisenbroeken, the area around the two red dots in the North Western part of the catchment. The source of the high nitrate concentration was a manure processing installation.
Click on the map to enlarge |
| 5 | Hotspot at a manure processing installation in the Veldbeek catchment On february 7th 2017, a Nitrate app (now: Aquality App) routing was done in the Veldbeek catchment in the middle of the Netherlands. The highest nitrate concentrations were measured at the three red dots just at the bottom left edge of the legend. This nitrate hotspot can possibly be related to an agricultural service provider with a manure processing installation.
Click on the map to enlarge |
| 6 | Hooge Raam catchment On February 21st 2017 a Nitrate App (now: Aquality App) routing was done in the Hooge Raam catchment. The nitrate concentrations were generally higher than in a previous routing in dryer conditions on November 25th 2016 . The highest concentrations were found in the effluent of a controlled subsurface drainage system.
Click on the map to enlarge |
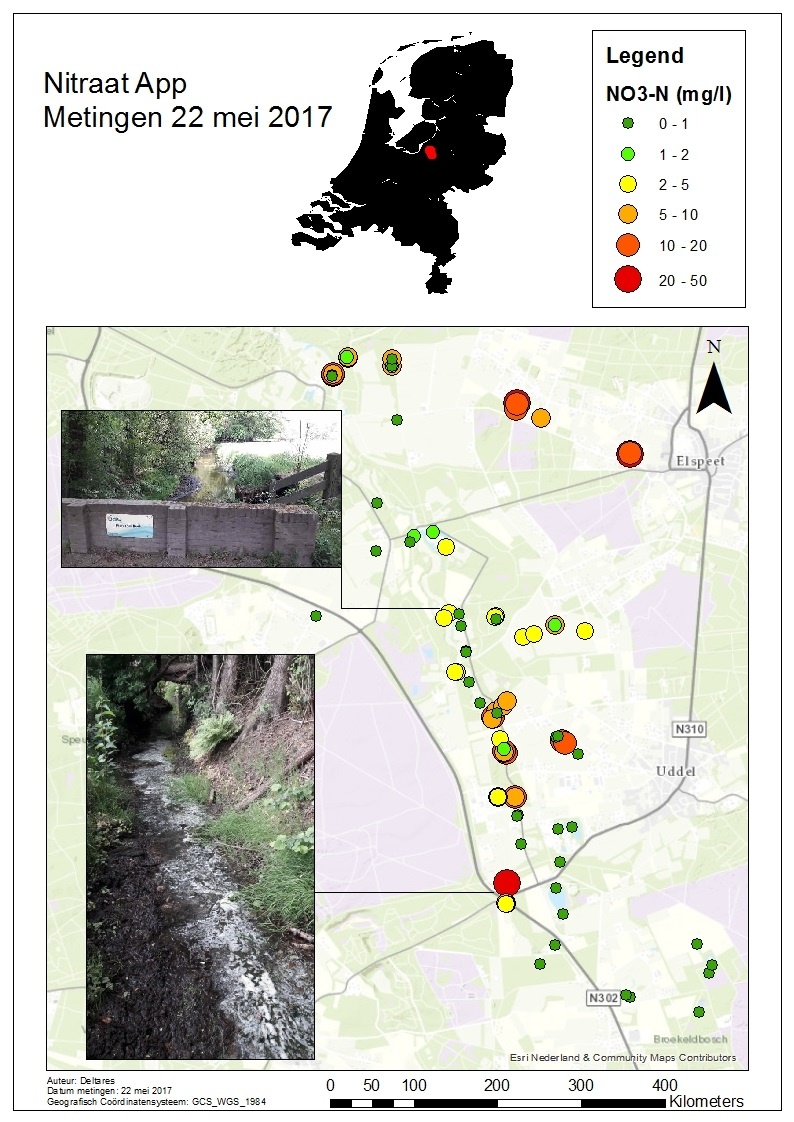
| 7 | Nitrate App (now: Aquality App) routing in the Hierdense beek as a Subsurface and Groundwater Quality department outing On May 22nd 2017 the Subsurface and Groundwater Quality department of Deltares generated this NO3 map of the agricultural Hierdense Beek catchment in Central Netherlands. The map was made by 5 groups of 3 team members who were equipped with a rental bike and the NO3-app (now: Aquality App). Several NO3 hotspots were found, one of which seemed to be a very local dump-site (see photo).
Click on the map to enlarge |
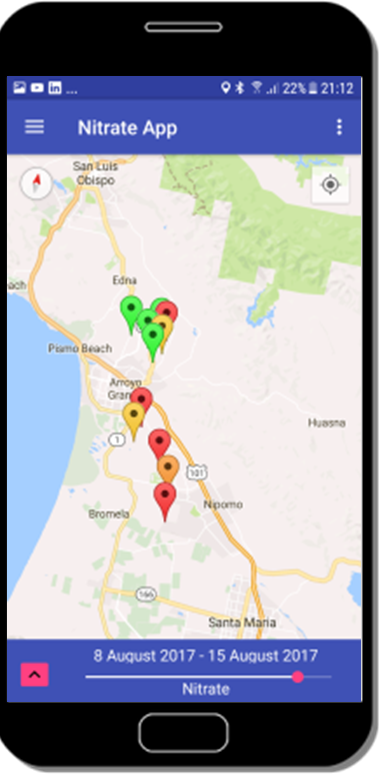
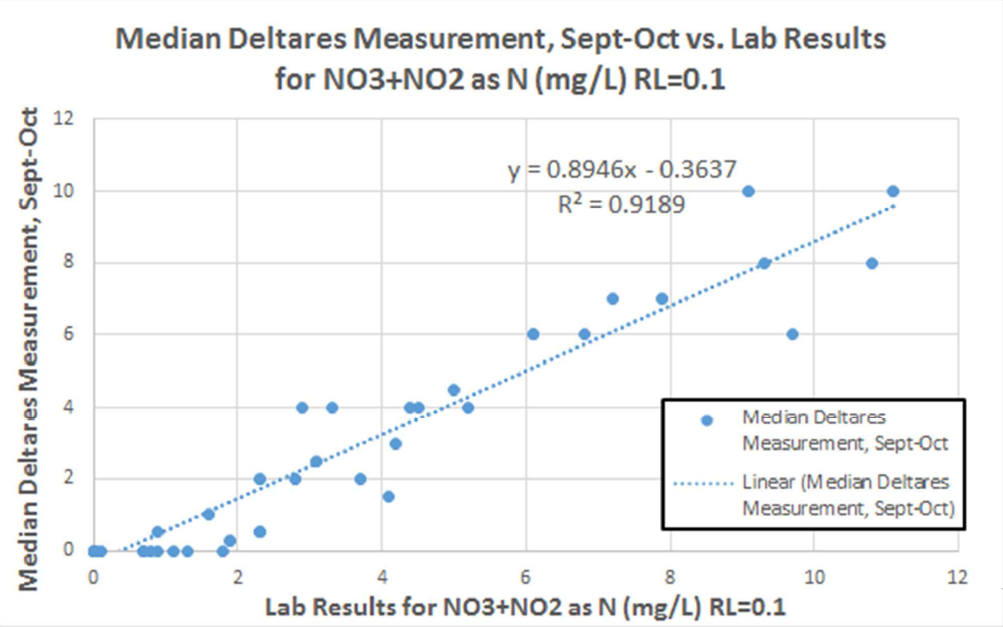
| 8 | Drinking water quality screening Around 250,000 people using 10,000 domestic drinking water wells in the Salinas and San Joaquin valleys in California are at risk of excessive exposure to nitrates3. The California State Water Resources Control Board alongside the Central Coast Water Board have been working on piloting the Nitrate app (now: Aquality App) to ensure its accuracy against laboratory results. This pilot project is testing the app as a screening tool for drinking water quality. So far, 100 wells in the San Luis Obispo County area have been sampled and tested for the pilot project. The first results look promising.
|
| 9 | Locating point sources Several Water Authorities in the Netherlands started applying The Nitrate app (now: Aquality App) for locating point sources of nitrate.
|
| 10 | Flow route contributions Is nitrate mainly transported to a stream via subsurface drains or via groundwater? A 3 hour screening was done on April 19th in the Salto river in Slagelse, Denmark. The nitrate concentrations in drainage effluent were significantly higher than in-stream concentration levels.
|


2 Comments
Anonymous
Hello,
Is there a way to access the research articles associated with these results? I am looking for more in depth information on the methods and results of these experiments or any other projects based on the application of the Nitrate app.
Thank you.
Joachim Rozemeijer
Hi! Sorry, there are no scientific papers ready yet. Most of these examples come from an internship report (in Dutch). Can you email me at joachim.rozemeijer@deltares.nl to let me know what information you are looking for?