...
python example. A Matlab simple example how to make a publication quality figure is given here
| Code Block |
|---|
%% laod openearthtools for handy tools such as nc2struct, pcolorcorcen, colorbarwithvtext, tickmap, axislat, findfont oetsettings %% load data (local cache), D contains data, M contains all metadata [D,M] = nc2struct('slib_juli2007.nc') %% load data (via opendap) L = nc2struct('http://opendap.deltares.nl/thredds/dodsC/opendap/deltares/landboundaries/northsea.nc') %% plot pcolorcorcen(D.longitude,D.latitude,D.mud) colorbarwithvtext([M.mud.long_name,'[',M.mud.units,']']) % add text inside colorbar to maximize use of paper space. automatically use metdata from netCDF file tickmap('ll') % add lat/lon as last tickmarks, no need for space, that dilute efficient use of paper space (google: Edward Tufte) grid on axislat % fix aspect ratio plot(L.lon,L.lat,'k') set(findfont,'fontsize',8) title({M.nc_global.institution,'NCP map mud [version jul 2007]'}) % automatically use metdata from netCDF file as title print2screensize('slib_juli2007') |
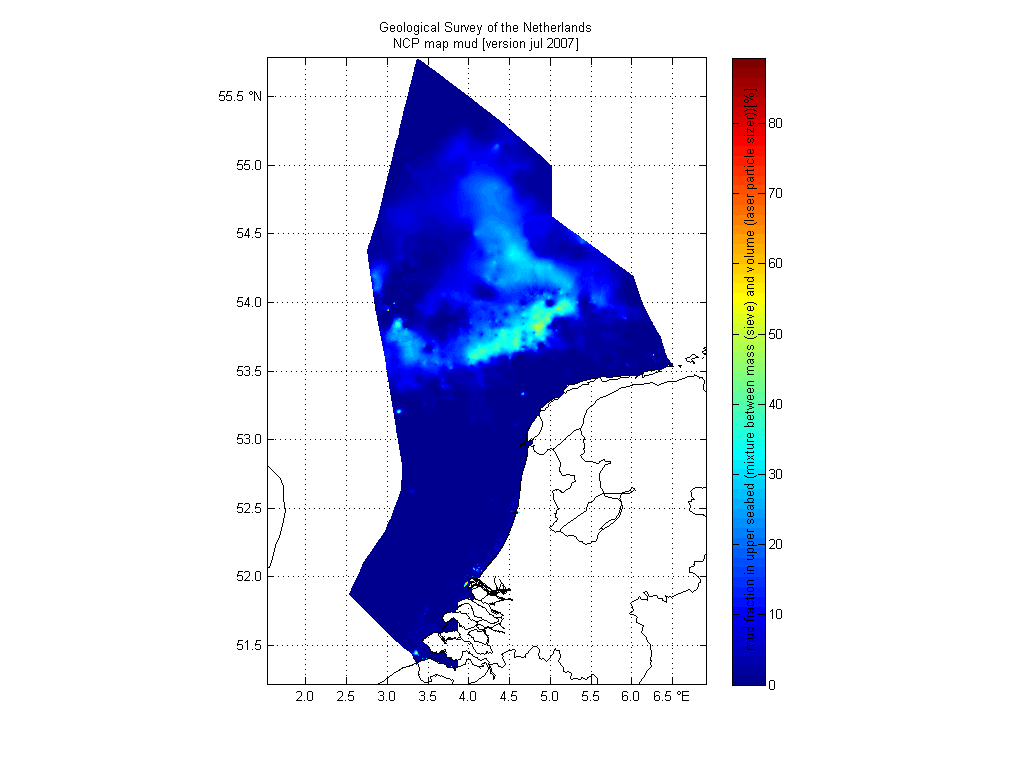
We used this image as Fig. 8 in our 2011 paper Mechanisms controlling the intra-annual mesoscale variability of SST and SPM in the southern North Sea.
| View File | ||||
|---|---|---|---|---|
|
...