...
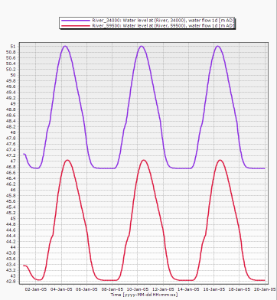
After running the model, right click anywhere on the network and select 'Query time series'. Then select, 'Water level'. A chart will pop-up with the requested time series.
Info If 'Query time series' is greyed out, first click 'select' and select the branch. Then click right again and select 'Query time series'. If you do not see 'select', right click closer to the branch. - Alternatively, double click on 'water level' in the output directory of the flow model in the Project Explorer. This will open the attribute table of the output coverage in the central map. With one or multiple records from this table selected, go to the 'map' tab in the Ribbon and click 'Query time series' from the Tools group. In this way, you should be able to create such graphs:
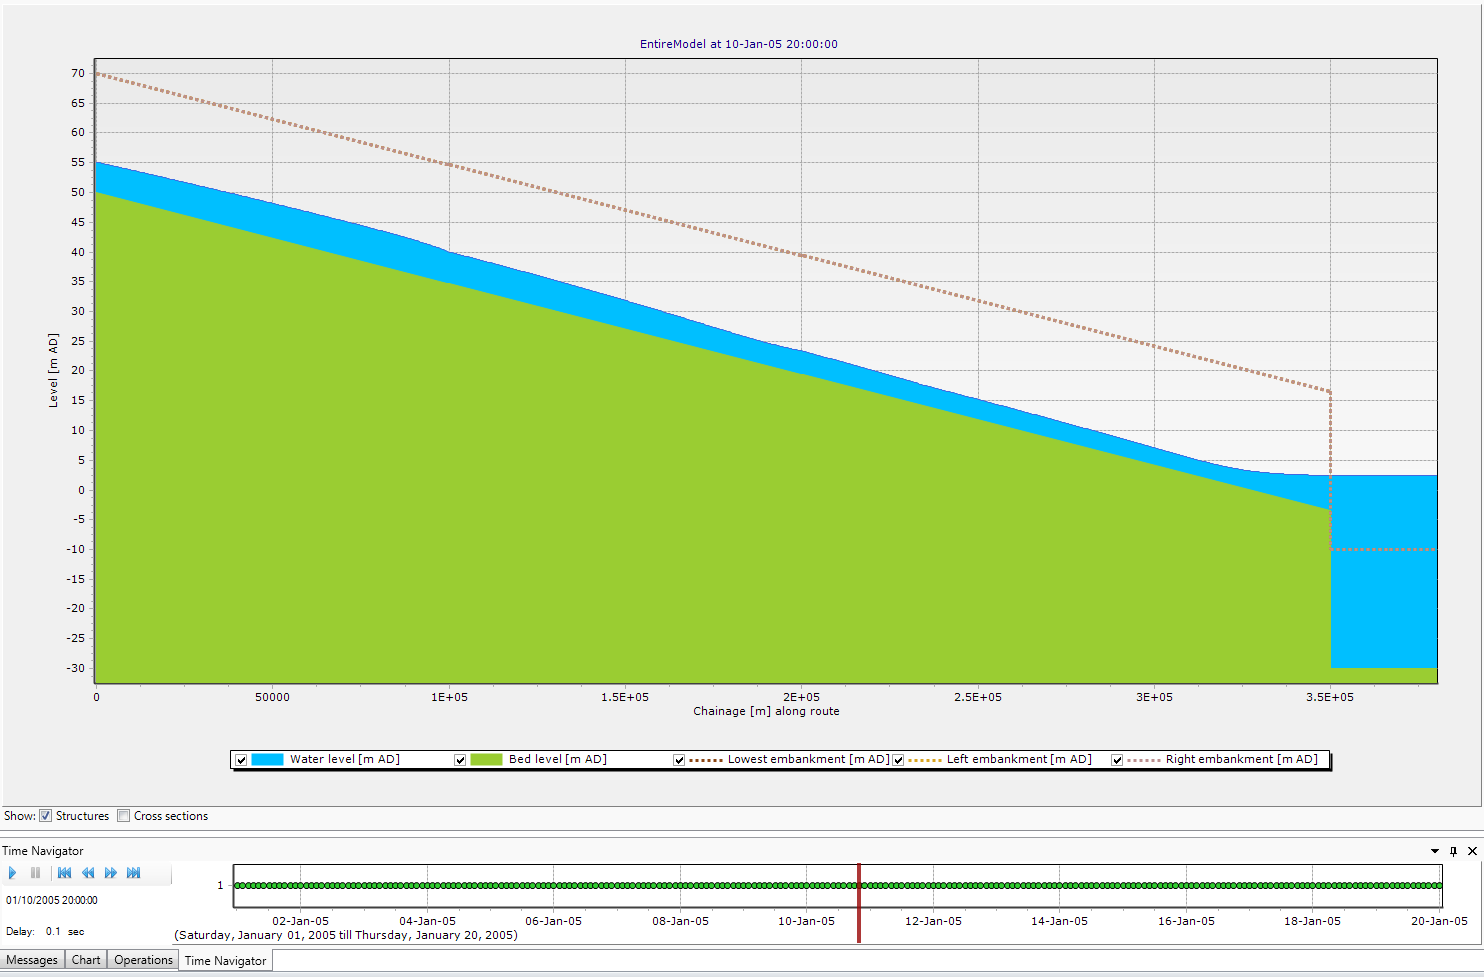
- Finally, let's revisit the sideview from the Add Cross-sections step 4-6. With the map open, open the sideview from the Ribbon. Below the sideview (in the same space as the Messages window), open the 'Time Navigator'. Inspect the progression of the flood wave by sliding the time navigator or pressing the 'play' icon:
This finishes this tutorial.
Related articles
| Content by Label | ||||||||||||||||
|---|---|---|---|---|---|---|---|---|---|---|---|---|---|---|---|---|
|