...
A basic interpolation of water levels, derived from the locations and water depths reported by Tweets, was used as a starting point. Several improvements over this simple method were evaluated. For example flooded areas that were not directly connected to any of the observations were removed from the flood map. Additionally the effect of grouping observations that belonged to the same flooded areas, either based on the vicinity of observations or common cells downstream of the observations, was investigated. A last method focussed on using the cells that lay downstream of observations, called the downstream flow paths of observations, to interpolate water levels along, see figure below. Also the use of Tweets that did not mention a water depth, by giving them a default water depth, was reviewed. Instead of using a digital terrain model to produce the flood maps, a height above nearest drainage map was used in this research, which reduced the risk of downstream overestimations of water level.

Interpolation along downstream flowpaths
Case studies
...
| Jakarta | York | |
|---|---|---|
| date | 8/2-11/2 2015 | 25/12-30/12 2015 |
| total number of filtered tweets | 219 | 87 |
| tweets with a water depth observation | 123 | 0 |
| average location error streets | 659 m | 287 m |
| average location error POI | 236 m | 52 m |
Besides analysing the Tweets gathered for both case studies, different methods of creating flood maps were evaluated. The flood extents created for the Jakarta case study were validated using information derived from photographs and the flood extents created for the York case study were validated using actual recorded flood extents. Using the method that created the most accurate flood maps, the uncertainty in flood extent, resulting from locational errors of Tweets, errors in water depths mentioned by Tweets and errors in the elevation data, was evaluated using Monte Carlo simulations. Also the effects of choosing a different default water depth value and using different resolutions on the uncertainty in flood extent was investigated. The comparison of the flood extents generated using the different flood mapping methods with validation datasets showed that for both the Jakarta and York case studies, the best results were obtained by interpolating water levels along the flow paths downstream of observations.
The flood extent calculated for Jakarta covered 75% of the validation points and a comparison of the flood extents calculated for York with recorded flood extents showed that the area of the flood extent that was correct, made up 69% of the total flood extent gotten by merging the created and recorded flood extents. Although two different validation methods were used, making it hard to compare both case studies, the quality of the flood extents varied between the cases. It was seen that in more flat areas, such as downstream Jakarta, flood extents were less precise than in areas with more slopes, such as the inner-city of York. These differences in topography also affected the degree to which errors in the datasets caused uncertainties in flood extent. These uncertainties were especially high in flatter areas, which were mainly affected by locational errors of Tweets and errors in the elevation data. In areas with steeper slopes, these errors caused considerably less uncertainty and at all locations the uncertainty caused by errors in the water depth specified by the messages, or default water depth used for messages that did not mention one, was only minor. Given these large differences in uncertainties, the scale at which maps could be produced varied from fine for the inner-city of York for which flood extents were delineated to within 50 m of their actual location, to more coarse in flatter areas such as downstream Jakarta, where deviations of up to 500m were not uncommon.


Jakarta modeled flood water depth (left) and flood probability (right)


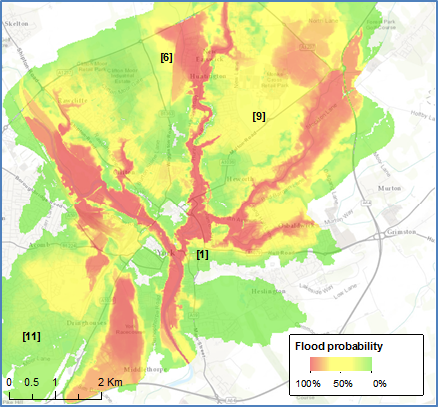
York modeled flood water depth (left) zoomed in to the city center (center) and flood probability (right)
...
The analysis of the time variation in the number of Tweets indicated that the severity of flooding was quite accurately reflected in the number of Tweets, there were too few Tweets in the datasets constructed for this research to do a thorough analysis of time variation. For the Jakarta case however, the dataset was intentionally reduced in size, since the Tweets had to be manually analysed. Although the flood mapping methods used in this research, given their limited computational time, allowed for real-time application, also the manual process of extracting locations and water depths from the Tweets, should be automated to make this possible. Additionally the process of creating uncertainty maps should be further optimized, since these do not accurately reflect the degree of uncertainty caused by locational errors and density of observations. For cases such as the York case, for which only a small amount of relevant Tweets was found, further methods to generate and find more relevant observations should be reviewed. If these issues are addressed however, the real-time flood maps and uncertainty maps created using Tweets have the potential of providing a wealth of information to for example rescue workers or other persons requiring flood information in real-time, where current methods such as hydraulic models and remote sensing are lacking.