...
The growth of social networks over the last decade has led to huge amounts of data, potentially containing valuable information about flooding, being available almost instantly. Several studies already looked into using this data, which either used it as auxiliary data for other methods to create flood maps or used the data to create flood maps directly. None of these studies however focussed on comparing different methods to create flood maps from social media data, or assessed the uncertainties in maps created using social media data. Therefore the objective of this research was to establish a preferred method of estimating flood extents from Twitter data and assess the uncertainties and applicability of the maps created using this method. Specifically Twitter data was used since it is openly and freely available. To achieve this objective, the research included a comparison of different ways of applying interpolation to create flood maps from the Twitter data, an assessment of the uncertainty in flood extent and a variety of analyses to investigate in what context the Twitter derived flood maps can be applied.
...
Methods
Filtering Tweets
The Twitter datasets used in this research were supplied by FloodTags. They analyse all Twitter messages in real-time and select messages which refer to flooding. A number of processing steps were applied on this data, to produce a database of Tweets that could be used in flood mapping, see figure with workflow below.
Flood mapping
A basic interpolation of water levels with reference to the local drainage level, derived from the locations and water depths reported by Tweets, was used as a starting point. Several The inverse distance weighting (IDW) interpolaion method was used here as it requires only limited computational time, smoothing can be used to filter the effects of outliers and the result does not have to be completely recalculated every time an observation is added. Several improvements over this simple method were evaluated. For example flooded areas that were not directly connected to any of the observations were removed from the flood map. Additionally the effect of grouping observations that belonged to the same flooded areas, either based on the vicinity of observations or common cells downstream of the observations, was investigated. A last method focussed on using the cells that lay downstream of observations, called the downstream flow paths of observations, to interpolate water levels along, see figure below. Also the use of Tweets that did not mention a water depth, by giving them a default water depth, was reviewed. Instead of using a digital terrain model to produce the flood maps, a height above nearest drainage map was used in this research, which reduced the risk of downstream overestimations of water level.

The most optimal method interpolates groups of observations based on their downstream flow paths. For each of these groups, water levels are interpolated along these flow paths. This assigns a water level to all cells belonging to a flow path downstream of an observation. The water levels throughout the study area are then determined by giving the water level value of each grid cell on the flow path, to all cells upstream of it (its subcatchment). Flooded areas which are not physically connected to any of these downstream flow paths are removed.
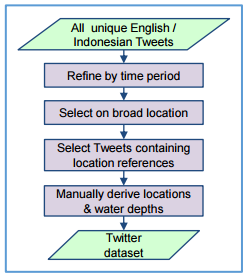

Left: Workflow for filtering tweets; Right: Interpolation along downstream flowpaths
...