...
To see an example of creating a time series plot with python using matplotlib, see the following Python Matplotlib time series example.

Javascript
locations plot
Using popular javascript libraries like leaflet, jquery and mapbox a web application can be made using the FEWS PI-JSON REST Web Service. The following example shows how to get all locations from FEWS and plot them on a map:
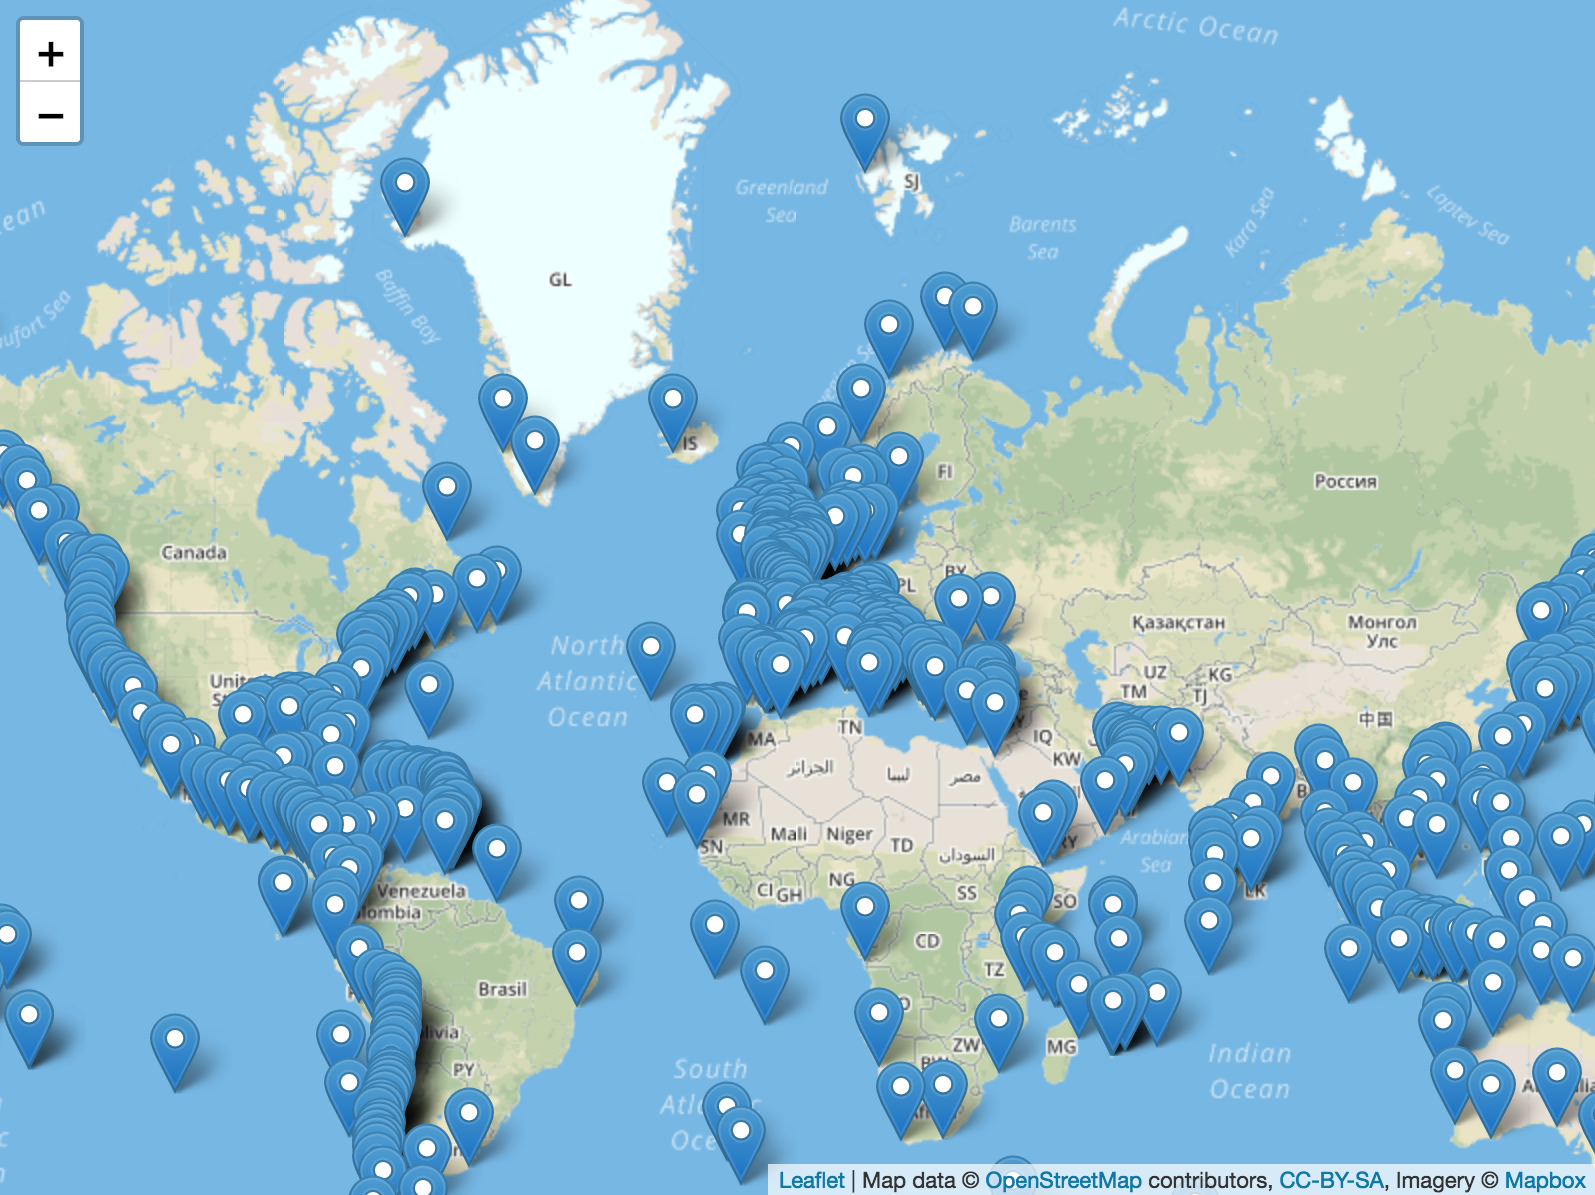
For the The javascript code seecan bee seen here: Javascript JavaScript locations Example
time series plot
The following is a time series plot using jquery and the morrisjs plot library.

The following javascript code demonstrates how the time series data can be processed to make a simple plot.