...
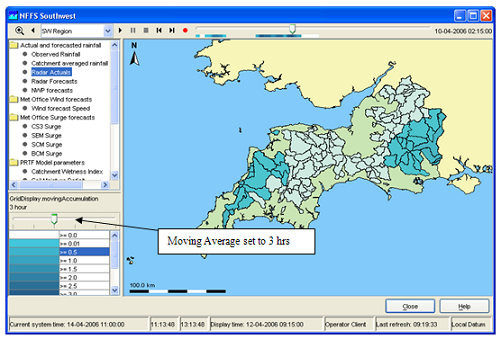
The moving average slider can be configured to allow the user to select a number of moving average settings. Each moving average window is then recalculated for the entire period.
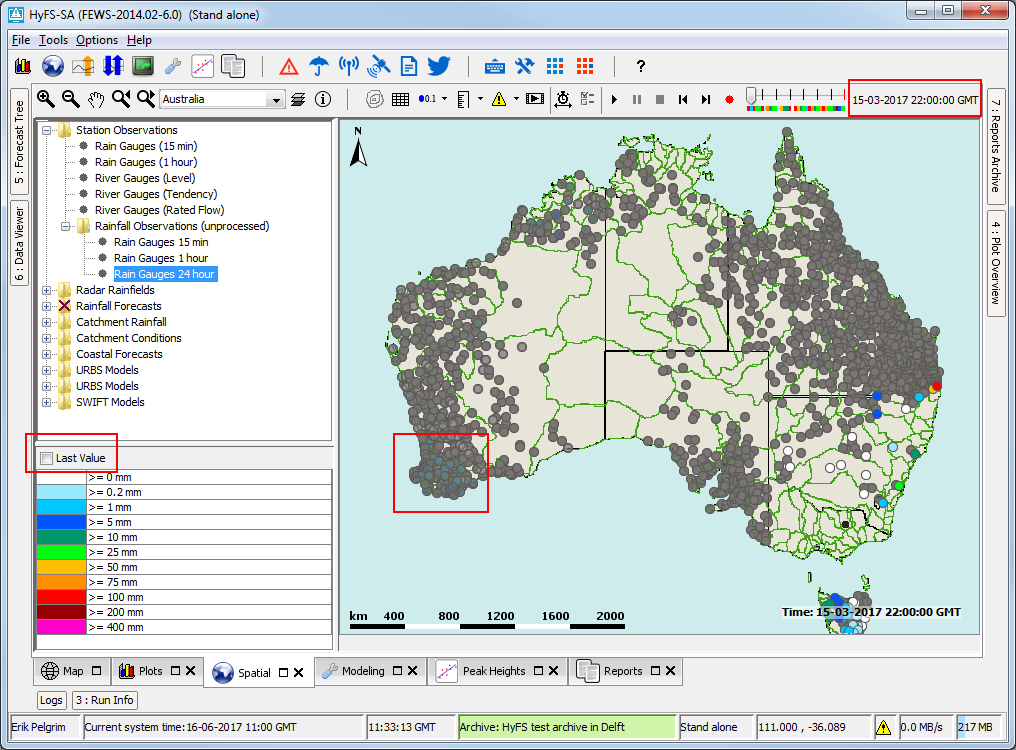
Last Value Checkbox
When selected this checkbox shows the last available of time series configured in the grid plot.
This can be useful when multiple timeseries with a different or non equidistant time step are defined within one grid plot and a time is selected where one time series does not have data.
The time series can be scalar or grid.
The next screenshots show how data with a daily time step will appear at 22:00 even though it is not defined for that time:

Legend
The legend identifies the colour used for each range of values. The range of values used for each colour can be rescaled by right clicking on the display and selecting 'Rescale Classification' from the pop-up menu. The display colours will be updated to reflect the new classification. After rescaling, the lowest and highest values in the legend will correspond to the minimum and maximum values of the data in the current zoom extent of the display (for the selected time slice). When the display is zoomed in on an area where all data points or grid cells have similar colours, rescaling can be used to see more clearly the differences in the data values. To return to the default classification right click on the display and select 'Back To Default Classification' from the pop-up menu. When selecting a different plot, the classification always changes back to the default classification for that plot.
The legend can be shown as table legend or as bar legend. Bar legend displays fluent scale bar as shown in the picture below:
...