| scrollbar |
|---|
<p><br /></p> |
| Table of Contents |
|---|
Forecast Manager
...
- management of forecasts
- setting current forecast
- change expiry time of forecasts
- Registration of workflows with modifiers
These four These three basic functions are available via individual tabs in the display.
The meaning of the icons in the table is as follows:
- the a fully current forecast is marked with

- a fully current local forecast is market with

- a partly current forecast is marked with
 (since 2021.01)
 - a partly current local forecast is marked with
 (since 2021.01)
 - an approved forecast is marked with

- an approved local forecast is marked with

- a partly failed forecast is marked with

The coloured circle icons indicate which state the system has used for each run:
In fact there are 6 different options (A to F) which can occur. The below mentioned table explains them.
Option | Manual Forecast (Dialog) | Scheduled Forecast Task | Result | Icon | Remarks |
|---|
1 | User selects cold state | - | cold state used |
| as expected: |

2 | User selects warm state | - | cold state used |
| not as expected: |

3 | User selects warm state | - | warm state used |
| as expected: |

4 | User selects no specific start state | Forecast runs with configured |
cold state | cold state used | no | as expected: |
5 | User selects no specific start state | Forecast runs with configured properties:
| cold state used |
| not as expected: |
6 | User selects no specific start state | Forecast runs with configured properties:
| warm state used | no | as expected: |
| 7 | User selects no specific start state | Forecast runs with configured properties:
For more information: backupWarmStateModuleInstanceId | warm state from forecast simulation was used | purple circle | used fall back option: warm historical state configured, but warm forecast state is used |
The icons with more details:
...
The tables in the display tabs can be sorted by clicking the headers of the columns.
Sort options
...
These options are available in all the tabs of the forecast management dialog.
By clicking any of the columns the list of workflows will be sorted either descending or ascending based on the values in that column. When you click again the order is reversed.
TIP: To easily filter on a specific forecast, you can sort on the approved column, which will put all the approived forecast on top, subsequently select the forecast you want, and "filter by selection".
Filter options
These options are available in all the tabs of the forecast management dialog.
For each table in the display tabs the list of visible forecasts can be filtered using the buttons next to the table. First select the text to use as a filter. Either click on a table cell to select all text in that cell. The selected cell will be recognizable since it has a thin blue frame :
...
It is also possible to use a displayed icon as a filter. First click on a table cell that contains an icon. Then click the 'Filter By Selection' button to filter the list of visible forecasts on the selected icon. After filtering only forecasts that have the same icon in the corresponding column will be visible. This can be used for instance to filter only approved forecasts.
Pressing the "filter by branch" button will shows a list of all module instances for the selected run. After selecting the module instance all task runs linked to the selected task run are displayed
To remove the filters, click the 'Remove Filter' button. All forecasts in the table will be visible again.
...
Please note that redownloading may require some time. After redownloading the forecast will still be visible in the lower listing.
Promote button
Since version 2021.02 a promote button is added, this can be used to promote a local run to an approved server run. It will show a popup in which a description can be added which will be stored with the run.
The button has been added for auto calibration which normally will just be local runs, when a user has found interesting results but might want to continue calibrating, this way the run is saved.

Current Forecast tab
A few definitions are required at the start of this section:
- Current Forecast
The Current Forecast is a combination of forecasts made for the whole region, which together form the current forecast. The current forecast is automatically downloaded to OCs. Location related icons are refreshed on the basis on the current forecast. The current forecast is always displayed in the Data Editor and -Display. A forecast can be partly current when not all module instance ids are written in the forecast that replaces the old forecast. This can happen when a sub workflow is made current or it can be a config error when module instance ids for simulated data are reused between workflows unintentionally. In the current forecast tab only the latest approved forecast per workflow is listed.
- Approved Forecast
Approved Forecasts have been approved by the system or manually by an FDO to become the Current Forecast. The latest Approved Forecast is the Current Forecast.
...
Under normal conditions the Current Forecast Forecasts will be updated automatically by the system on the basis of the results of a successfully completed scheduled forecasting run. There is always a Current Forecast that covers the whole region: all fluvial and coastal forecasting locations. The forecasts that together form the Current Forecast are listed in the upper table of the tab. These These forecast are marked with the icon  .
.
...
In the list of forecasts that together form the Current Forecast, 'overlapping' forecasts may be displayed. A forecaster may for example run a what-if scenario for part of a catchment for which already an automatic forecast has been made that is part of the Current Forecast. When the forecast with the what-if scenario should now become part of the Current Forecast it can be selected in the lower table of the Current Forecast tab and with [Approve] moved to the upper table. The upper table now displays both forecast runs: the original forecast whole catchment and the forecast with the what-if scenario for part of the catchment. The system will override the data of the original workflow for the part of the catchment that has been rerun when presenting the Current Forecast.
Forecast Expiry Time tab
...
The Forecast Expiry Time tab allows for:
...
To change the expiry time of individual forecasts, select the forecasts in the table with the mouse and press [Change Expiry Time]. In the dialog that appears, select a new expiry time and press [Apply] to change the expiry time of the selected forecasts. The expiry time can only be changed for forecasts for which the user has delete permission.

Modifiers tab
The modifiers tab of the forecast management display allows for the following functions:
- Listing modifiers that were used in the selected workflow
- Restoring modifiers that were used (and now inactive) for the selected workflow

In the top panel the user can select the forecast workflow. Once selected the bottom panel will list all the modifiers that have been used. When the modifier is still active the first cell of the row is green, when it is inactive this cell is grey and the entire row is striked through.

By clicking the restore icon in the last column, the modifier will be restored (made active again). With this action a new modifier is created, which is a copy of the original modifier.
Popup Menu
Popup menu can be opened from any Forecast Management tab by selecting a forecast and using right mouse button.
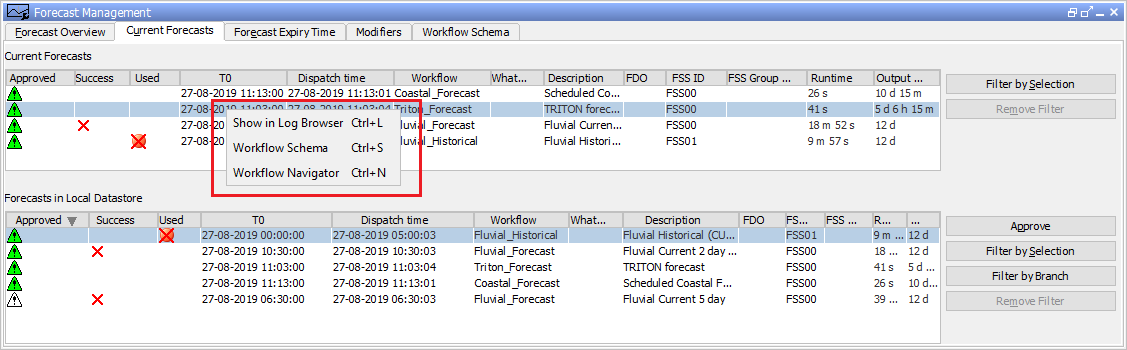
Menu “Show in Log Browser Ctrl+L ” opens System Monitor with Log Browser tab selected. In the Log Browser all messages associated with the selected forecast are listed.
Menu ‘Workflow Schema Ctrl+S’ opens a new tab Workflow schema. Workflow Schema will show the workflows that have been involved to create the selected forecast and all input workflows that have generated input for that forecast (note that the workflow dependencies must be configured in WorkflowDescriptors.xml with elements 'inputWorkflowId'.
Menu “Workflow Navigator Ctrl+N” opens Workflow Navigator. Workflow Navigator will show the workflows and modules that have been involved to create the selected forecast. Use the Workflow Navigator popup menu to display the timeseries that are associated with the forecast that has been selected in the Forecast Management display.
Menu’s “Show in Log Browser Ctrl+L ” and “Workflow Navigator Ctrl+N” appear only if explorerTask for System Monitor and for Workflow Navigator are configured in Explorer.xml
Display configuration
It is possible to add display configuration for forecast management, for example adding colors based on age of the forecast. for more information information click here.