...
| | | ||||||
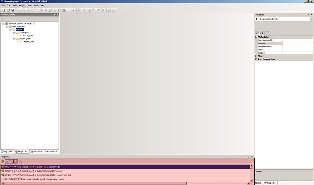
Menu area | Toolbar | Project Explorer
| ||||||
| | | ||||||
Working area response curves and maps |
| Messages area | ||||||
Click at a picture to enlarge |

Nog toe te voegen: window + beschrijving map contents
The Project Explorer shows you if maps are available (yellow cube in front of map), if they do not exist (yet) with a yellow cube and red cross or if they are linked with output from other models (boxed arrow before the yellow cube). It also indicates if HABITAT is calculating and what model or scenario is being calculated. The scenario or model which is calculate is highlighted in dark blue. An example of these situations is presented below. The scenario 'Water level and Turbidity' is being calculated. Whithin this scenario HABITAT is busy with the model 'Depth'. The input map 'hoogte' and two of the result maps 'Depth_av_summer_seaswetl' and 'Diepte_min_zomer' are already there, but the third map 'Diepte mask' still needs to be produced. The other models and scenarios, presented under the highlighted scenario and model will be calculated next.
...