...
You can access subsets these files with the Matlab netCDF package called ncread and with the python package netcdf4-python, see our Matlab example and
python example.
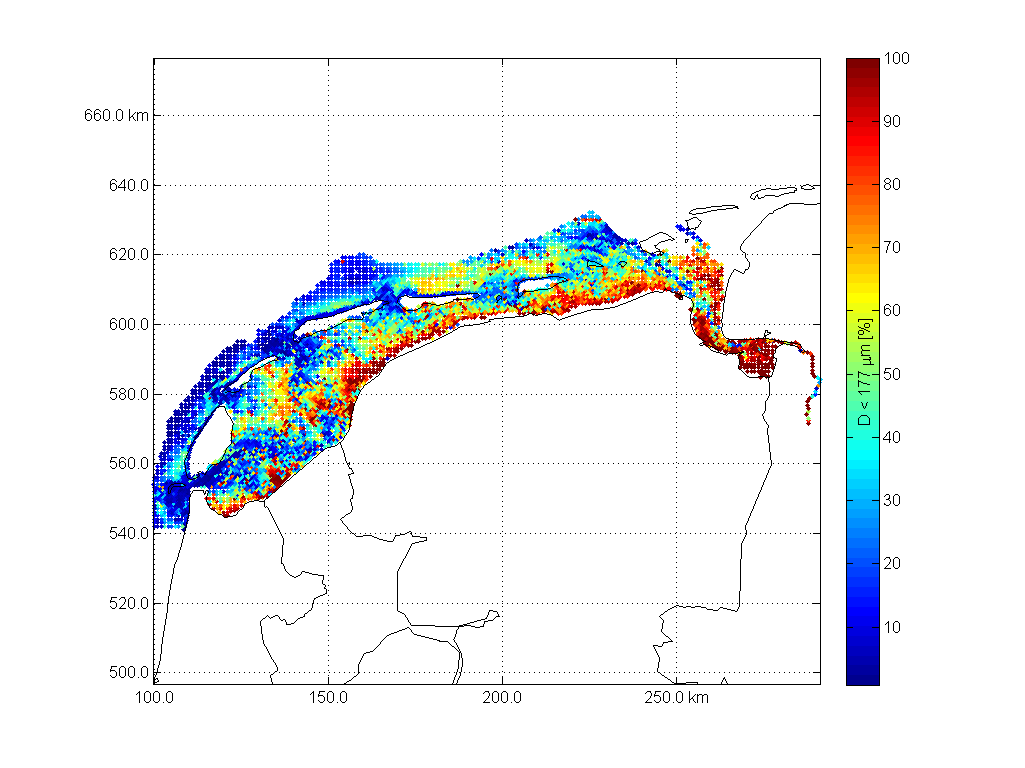
TNO grain
...
size maps
A Matlab simple example how to make a publication quality figure is given here
...
| Code Block |
|---|
 %oetsettings
%% load data
 F          = 'http://opendap.deltares.nl/thredds/dodsC/opendap/rijkswaterstaat/sedimentatlas_waddenzee/korrel.nc';
 D.lon      = ncread(F,'lon');
 D.lat      = ncread(F,'lat');
 D.cumphi   = ncread(F,'cumphi');
 D.diameter = ncread(F,'diameter');
[D.x,D.y]   = convertCoordinates(D.lon,D.lat,'CS1.code',4326,'CS2.code',28992);% wgs84 to RD
fraction = 10; % fraction to work with

%% add coastal data
L = nc2struct('http://opendap.deltares.nl/thredds/dodsC/opendap/deltares/landboundaries/northsea.nc')
[L.x,L.y]   = convertCoordinates(L.lon,L.lat,'CS1.code',4326,'CS2.code',28992);% wgs84 to RD

%% plot data
caxis            ([0 100])
scatter          (D.x,D.y,20,D.cumphi(fraction,:),'.')
colorbarwithvtext(['D < ',num2str(D.diameter(fraction)),' \mum [%]'])
axis equal
grid on
tickmap          ('xy')
axis(axis)
hold on
plot(L.x,L.y,'k')
box on
print2screensize(['sedimentatlas_waddenzee_fraction_',num2str(D.diameter(fraction)),'mm'])

%% plot in Google Earth
 KMLscatter(D.lat ,D.lon ,D.cumphi(10,:),'fileName',['sedimentatlas_waddenzee.kml'],...
    'CBcolorTitle',['D < ',num2str(D.diameter(fraction)),' \mum [%]'],...
 'CBcolorbarlocation',{'W'});
|