...
Introduction & summary
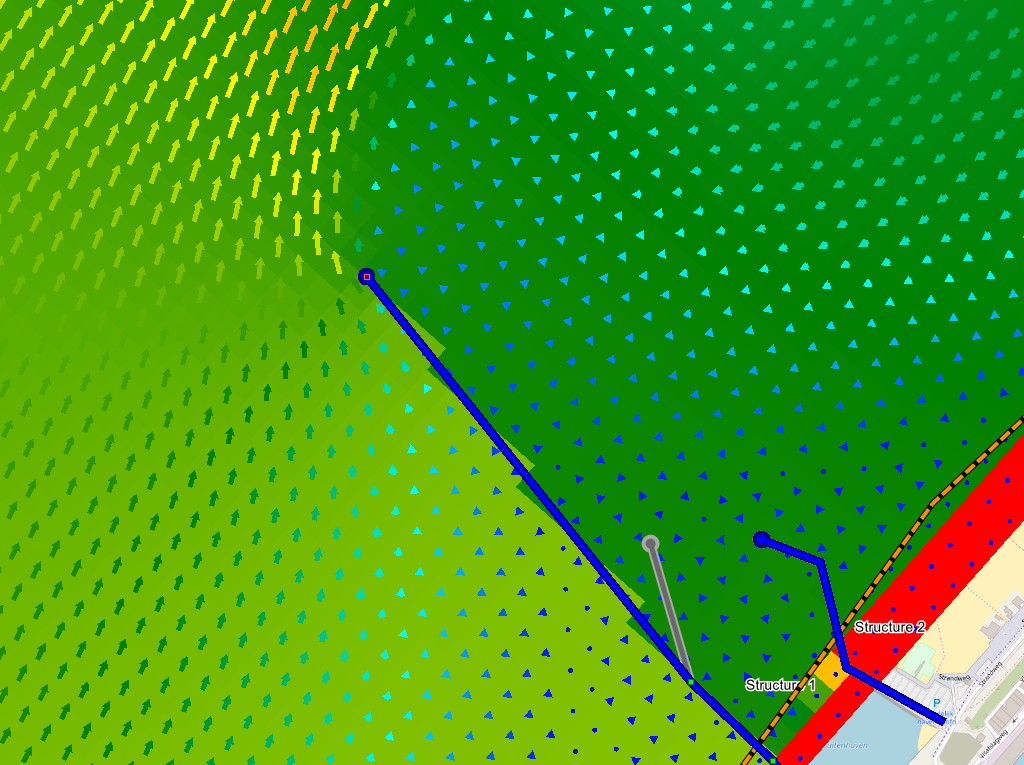
In this tool (flowfieldsFlowfields) you can compute flowfields in a region of interest, including relevant different boundary conditions, local bathymetry and breakwater structures.
The tool requires a shoreline, cross-shore profile and tidal characteristics (you can inspect the generic data availability in the top panel of the tool). Breakwaters will also be used in case they are provided. Breakwaters fully block flow, and can be changed interactively.
...
- Open a new project
- Start in Generic Data by data by defining a Coastline, bathymetry (a Crosscross-shore profile (a slope, spatially varying bathymetry is optional) and tidal characteristics.
- If required, define breakwater structures.
- Open the Flowfields tool.
- Choose a grid resolution and click on the "Draw grid outline" button (
).
Now, drag a grid extent on the map, while keeping your left mouse button pressed:
- Press the "Rotate/move grid outline (
 ) button to move and rotate your domain.
- Hold CTRL to rotate the grid outline. the blue box indicates the grid extent, while the arrow indicates the offshore direction.
- Hold SHIFT to move the grid outline, the blue box indicates the grid extent.
- The type of model boundaries can be set in the section 'boundary conditions'. You can choose from the following types of boundaries:
- Water levels, defined on the offshore boundary
These are defined by the tidal components in generic data - Currents, defined on the lateral boundaries
These are defined by the max. horizontal tidal velocities from in generic data
- Water levels, defined on the offshore boundary
- Press the delete button to delete the coastlines from the map.
- A spin-up time can be defined (in HH:MM:SS format) after which the
- The model will only show output on the map after the spin-up time has passed
- By pressing the PLAY button <BUTTON>(
 ), the simulation is started.
 - After completing the spin-up period, the model will indicate the water levels and flow velocities.:

- The plotted variables can be changed in the section "Visualization".
- A combination of 'currents', 'water levels', 'bathymetry' and 'grid' can be made.
- During the simulation, any breakwater (point) can be moved around by clicking on <BUTTON>the button "Move points of temporary structures or delete structure" (
 )
)- The interactive flowfields will automatically update
- Note that you can also save your breakwater changes to the generic data (for use in other tools), by pressing the button "Set temporary structures to structures"
- You can interact with the model progress:
- Click <BUTTON> to pause
- Click <BUTTON> Click to start /resume
- Click <BUTTON> to stop the simulation
- or resume the model (depending on the status of the model)
- Click
 to pause the model
 - Click
 Click <BUTTON> to compute a single timestep
 - Click
 to stop the simulation and redefine a model domain
Please be aware that the speed of a Delft3D Flexible Mesh model (and thus this tool) scales:
- Linearly with with the number of gridcells
- E.g. increasing the area of the entire model domain by a factor 2, will yield a model that is 2 times slower model
- With a To the power 3 (!) related to the defined cell size
- E.g. changing the cell size from 200 to 100 m (for the same model domain), will yield a model that is 8 times slower model (2 x 2= 4 times (4x as much gridcells (in x and y direction), see item above, while the model timestep also typically decreases by a factor 2)
- Linearly with the maximum flow velocity
- E.g. increasing the maximum velocity by a factor 2, will yield a model that is 2 times slower model slower (e.g. by changing a flow boundary condition or by flow contraction using breakwaters)
All other tool modifications, such as visualisation, have a limited effect on model and tool performance.
Temporary files
The model files are stored in the following temporary folder, for use outside of CoDeS:
- C:\Users\smith\AppData\Roaming\Deltares\CoDeS\Workdir\ (note that in this case, C:\ is the windows-drive, and 'smith' the example username
User input fields
A number of user input fields and funtionality is provided to adjust modify the model simulation to reflect the local situation. Default values are provided for each input field. The following inputs are defined:
...
- This section allows you to setup the domain of the Delft3D Flexible Mesh model. Apart from buttons that allow you to draw a grid outline outline (
 ) and move/rotate it (), the following keywords are defined:
...
| Default Value | Unit | Min. | Max. | Brief Description | |
|---|---|---|---|---|---|
| Vector scale | 1 | - | 0.0000001 | Inf | Scaling of the velocity vectors. Smaller values show larger arrows. Note that negative values flip the arrows |
General
Apart from the play, pause, 1-step and stop buttons (![]() ,
, ![]() ,
, ![]() and
and ![]() ), the following keyword is defined in this section:
), the following keyword is defined in this section:
| Default Value | Unit | Min. | Max. | Brief Description | |
|---|---|---|---|---|---|
| Spin-up time | 0 | HH:MM:SS | 00:00:00 | Inf | Spin-up time (period) after which model results are updated on the map (the spin-up time is ignored during visualization) |
Also note that the "current model time" and "time step number" are shown here for information.
Tool limitations
The Delft3D Flexible Mesh model is a rough representation of the area, and governed by the limitations to the Delft3D Flexible Mesh modelling Suite, as well as governed by the quality of the boundaries, bathymetry quality , etc.
Furthermore, the models are 2-dimensional and do not account for temperature, salinity and or sediment transport.
The model files are stored in the following temporary path, for use outside of CoDeS:
...
Example cases
The following files file (.dsproject) can be downloaded and loaded into CoDeS to serve as examples. They are an example. It is not based on actual projects, but are intended as illustration.
Unzip the files to a convient folder (but make sure the file structure does not change), and open the .dsproject file from within CoDeS.
| View file | ||||
|---|---|---|---|---|
|