Threshold Overview display
The threshold display is a display plug-in that allows the user to see at a glance which locations have forecasted threshold crossings, a summary of alarms and more detailed information about specific site forecasts. For a description of the functionality available - please see the user guide.
The Id of the threshold display is identified in the DisplayInstanceDescriptors. When available on the file system, the name of the XML file for configuring the display with an Id of e.g. Correlationdisplay Threshold overview display is for example:
Correlationdisplay Thresholds_overview_display 1.00 default.xml
Correlationdisplay Thresholds_overview_display | File name for the Correlationdisplay configuration as specified in the display instance descriptors |
1.00 | Version number |
default | Flag to indicate the version is the default configuration (otherwise omitted). |

Figure 153 1: Root elements of the configuration threshold overview display configuration.
inputTimeSerieInfo
TimeSeriesSet defined for the input data. This time series set is used when applying the correlation established to a complete hydrograph.
eventSetsDescriptorId
Id of the correlationEventSets to be used in the display. The event set must be defined in the CorrelationEventSetsDescriptors configuration (See regional Configuration).
travelTimesDescriptorId
Id of the travelTimesDescriptor to be used in the display. The travel times set must be defined in the TravelTimesDescriptors configuration (See regional Configuration).
outputTimeSerieInfo
TimeSeriesSet defined for the output data. This time series set is used only for displaying the temporary time series to be displayed when applying the correlation established to a complete hydrograph. This time series is not saved in the database.
correlationDisplayOptions
Root element of options element for setting line colours in the scatter plot.
Figure 154 Elements of the scatterplot item in the CorrelationDisplay configuration
scatterplotOptions
Options for setting the properties of the scatter plot. The lineStyle of the scatter plot is "none" by definition (need not be defined).
equationOptions
Options for setting the properties of the regression line determined with the equation established.
preferredColor
Preferred colour for plotting scatter plot / regression line. For enumeration see timeSeriesDisplay Configuration in System Configuration.
markerStyle
Marker style for scatter plot / regression line. For enumeration see timeSeriesDisplay Configuration in System Configuration.
markerSize
general

Figure 2: General elements
This section gives the title of the dialog and allows the user to filter for workflows which are to be displayed e.g. Coastal_Forecast
displayDescriptor

Figure 3: Display descriptor elements
The section of the configuration forms the main part of the configuration. Each "tab" has different functionality and shows a different aspect of the data. Tab 1 shows multiple hour threshold crossing aggregates (i.e. highest crossing over 4 hours). Tab 2 shows highest alarms on an hourly basis. Tab3 gives a text summary of alarms and the optional tab 4 can be used to show additonal site data.
inputVariable
Standard timeseries set with variable ID required
columnAttributes
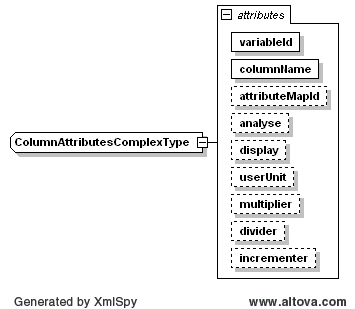
This section of the configuration relates specifically to the configuration of the site data in tab4Marker size for scatter plot / regression line in points.