...
The tags startDateTime and endDateTime relate to the columns in the file mapLayersFiles/myLocationFile.csv. This csv file defines which locations are in the locationSet example.
Besides defining the locations in a csv file it is also possible to define the locations in a dbf file.
...
After this date the related location will change to location C.
To configure this the following csv (or dbf) file should be used:
ID | NAME | X | Y | START | EINDE | PARAMETERS | REL |
1 | A | 12345 | 54321 | 1-1-2000 | 1-1-2014 | P1 | B |
1 | A | 12345 | 54321 | 1-1-2014 | P1 | C | |
2 | E | 11223 | 32211 | 1-1-2000 |
| P2 | M |
3 | X | 12321 | 12321 | 1-1-2003 | 1-1-2010 | P2 | F |
First a row should exists in the csv (or dbf) file of this locationset with the value A in the column ID and the column which defines the relation (REL) should have the id
B of location B. The EIND column should indicate that this is valid until 1-1-2014. The START column should indicate the start date of this relation. A second row with the same value A for the ID column should also exist. The START column should indicate that this row is valid from 1-1-2014. The EIND column should indicate the end of this relation or should be left empty if there is no end date known for this relation.
The column REL should have the value C to indicate that the related location is C.
In the case that the related location of a location can vary over time but that a lot of attributes stay constant, it is useful to define the constant attributes in a separate attribute file. In the example above an attribute file (attribute.csv) is configured. This file should be located in the same directory (mapLayersFiles) as the file myLocationFile.csv.
The attributes which don't vary over time can be placed in this file. In the case that the attributes defined in the attributes.csv file also vary over time it is possible to for which time periods attributes are valid
However is some cases the attributes also vary over time but vary independent of the of location they belong to. The location might for example change its relation only once while some attributes are changed every year. If this is the case then one should also place these attributes in a seperate csv (or dbf) file. The way the start- and end time of the attributes are configured is comparable to how the start- and end time of the location itself is configured.
The element csv file contain an element startDateTime and endDateTime which define the columns which contain the start and endtime of a single row of attribute definitions.
The configuration of the start time and end time of a location and its attributes must be configured according to the following rules:
- The period in which the location exists in FEWS (visibilty period) is derived from the main configuration file in the locationSet configuration
- The periods defined in the attributes file should be consistent with the visibility period defined for the location. If all the periods defined in the attributefile for a certain location were combined they should span the exact period if all the periods defined in the main configuration file were combined to a period. If this is not the case an configuration error will be thrown during the startup of FEWS and the behaviour of the system with regard to time dependent locations is undefined.
in a similar way as it can be done for the location file.
Grid display
The grid display supports the usage of time dependent locations and polygons. The time displayed in the grid display can be varied by using the time slider at the top of the display. In a FEWS system were locations are not time
...
| Code Block | ||||
|---|---|---|---|---|
| ||||
		<esriShapeLayer id="Peilgebieden">
			<file>peilgebieden_example</file>
			<visible>true</visible>
			<selectByMapItemLocationRelation>
				<relationId>PEILGEBIED</relationId>
				<locationId>%GPGIDENT%</locationId>
			</selectByMapItemLocationRelation>
			<toolTip>%GPGNAAM%</toolTip>
			<timeZoneOffset>+01:00</timeZoneOffset>
			<dateTimePattern>dd-MM-yyyy</dateTimePattern> (optional)
			<startDateTimeAttributeName>STARTDATE</startDateTimeAttributeName>
			<endDateTimeAttributeName>ENDDATE</endDateTimeAttributeName>
		</esriShapeLayer>
|
When a user double clicks on a spot in a shape in the grid display, the plots dialog will automatically open and the time series of the selected polygon will be shown. But with the introduction of time dependent locations it is possible that the polygon which overlaps a selected geographical point varies over time. If this is the case and the user double clicks on a spot where the overlap in time occurs, the time series shown in the plots display will also vary over time, so multiple time series will be visible for the total period.” The MapToolTip (button "tooltip") also takes into account that locations and the related polygons can vary over time.
...
By default the map display and filters will not take into account that the locations shown are time dependent but show the situation as it is at the display time. In the explorer.xml it is possible to configure that the map display shows a time slider when locations are shown on the map which are time dependent. Activating the time slider should be considered as going into a sort of special mode which allows to view how locations were configured in the past.
| Code Block | ||||
|---|---|---|---|---|
| ||||
<locationHistoryBarRelativePeriod unit="week" start="-100" end="100"/> |
...
The time slider will show a time mark for each time there was a change for a location (in the view period were a location shown in the display changes). The default view period will be the period configured in the explorer.xml. The view period can be changed by selecting the button "Period history time slider" (button with the clock and arrows).
The t0 can be set to the selected time in the time slider by the button "Set t0 to the selected time". If a location is not visible at the selected time in the time slider, the location will still be shown in the map and the filter, but will be greyed out to indicate that it is not valid at the selected time. For performance reasons the icons in the filters will not be updated according to the selected time when the time slider is shown in the map display. Activating the time slidershould be considered as going into a sort of special mode which allows to view how locations were configured in the past. The MapToolTip (button "tooltip") and MapItemSelectTool (button "select locations with lasso tool") take into account the selected time in time slider. If the time slider is not selected the system time is used.
Time dependent map layers
The map layers can be configured in the SystemConfigFiles/Explorer.xml file.
In typical WIS systems users still want to have access to the data although the locations has been "stopped" by the provided stoptime. Therefore, the option <showLocationsOutsideVisibilityPeriod>true</showLocationsOutsideVisibilityPeriod> can be defined in Explorer.xml to show all locations no matter the start-/stoptime in de Filters. Locations outside of the defined start-/stoptime will be marked using black/gray crosses instead of the typical red/darkred ones for missing data.
Filter change events
Since 2016.02 a filter button has been added which lets the user choose which change events should be included. The change events are grouped by type of change events recognized in Delft-FEWS: Map Layers, Locations, Location Attributes, Location Relations;

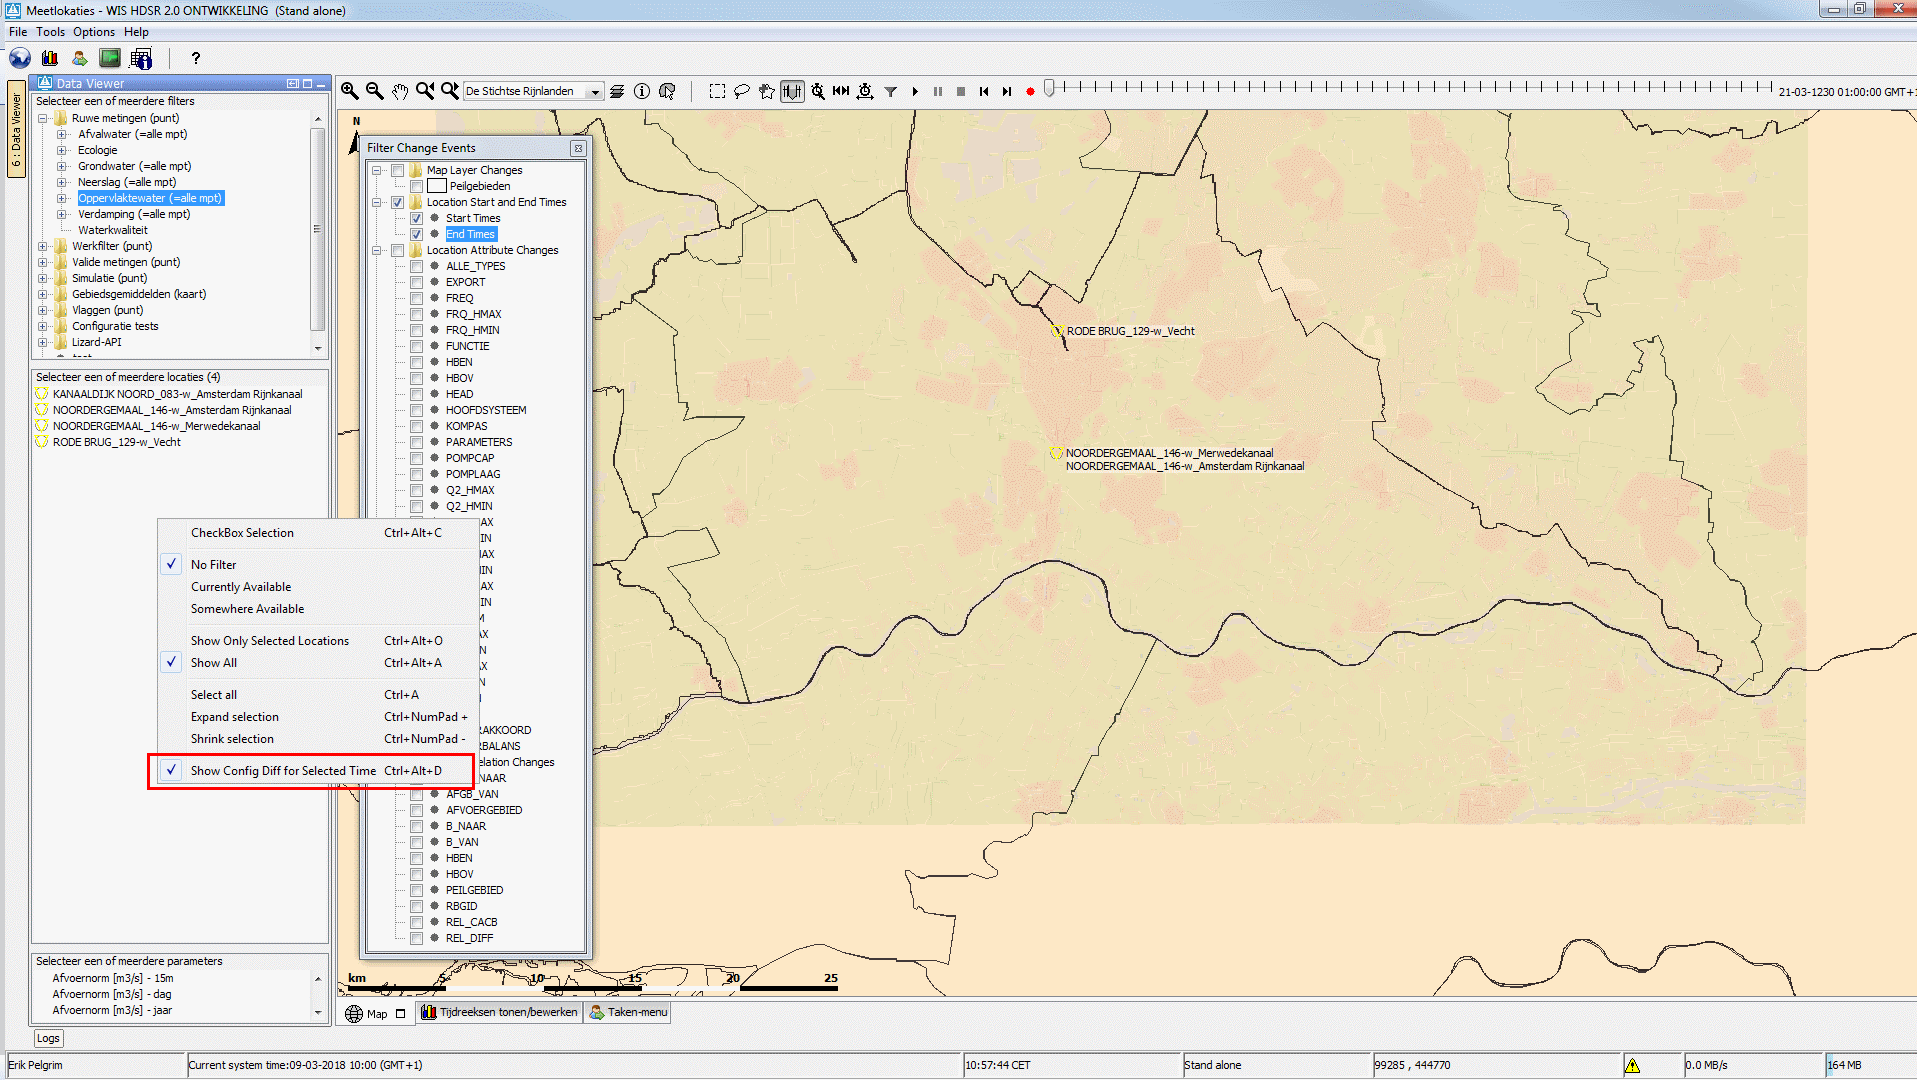
Together with the context menu option for location filter "Show Config Diff for Selected Time" (see screenshot below) it will show a clear overview of the locations that have changed on that time step:
By default only the start and end time of the location are included, but this can be changed by (de)selecting any number of checkboxes.
The number of time steps in the slider will change accordingly:

Time dependent map layers
The The map layers in the map display can be made time dependent in the same way as the map layers in the grid display .(configuration in the SystemConfigFiles/Explorer.xml file). The example in the section Grid display shows how this can be done.
...
The transformation module automatically takes into account the time dependency of the locations. No configuration is needed in the transformation module. If an end time is introduced for a location and time series are in the database for this location after the end time, then the part of the time series which is not valid anymore will not be read from the database. The benefit of this approach is that the configurator doesn't need to remove obsolete parts of time series for the location from the database.
Note: the usage of time dependent location relations and time dependent location set constraints is not supported in the transformation module before 2020.01 because this requires to switch the location itself during the transformation. This will be supported from 2020.01 onwards. There will be a warning for transformations that do not support this, this will mainly be transformations that have multiple time input and or output (like aggregation and accumulation), because the individual transformation can not handle a change in within their input or output period.
Secondary validation
The secondary validation module also takes into account the time dependency of the locations. The secondary validation will only run if all of the used locations are valid, the values of location attributes used in the
...
In that case the location of variable A will be used to determine the value of the location attributes. After that, the secondary validation will run for validating variable B which will mean that the location of this variable will be used.
Chainage Location Sets (since 2020.02)
Since 2020.02 it is possible to use time dependent chainage attributes to determine a longitudinal profile.
The longitudinal profile will be visualized with all chainage locations that are part of the profile at any time in the period of the time slider.
When at a specific moment in time a location is not part of the profile a missing value will be shown in the table, but the graph will just connect the line to the next location that is part of the profile.
The 