
Introduction & summary
In this tool (breakwater design) you can compute required dimensions, overtopping, cross-sections and costs of rubble mound breakwaters.
The tool requires at least a breakwater and bathymetry data (you can inspect the generic data availability in the top panel of the tool).
Optionally, any generic wave data can also be used, in order to fill the wave condition fields.
Computations of breakwater dimensions and costs are based on rough guidelines in the Rock manual.
Results of the breakwater tool should therefore be interpreted with a considerable range of uncertainty.
...
- Open a new project
- Start in Generic Data by defining:
- a Coastline,
- a Cross-shore profile (both a slope and a spatial varying field are supported by this tool),
- at least one breakwater structure. Make sure that the breakwaters intersect with the coastline,
- extreme wave conditions (optional).

- Open the Breakwater design tool.
- Provide input according to the user input field description below. After selecting the breakwater, grey dots are shown along the breakwater to indicate the cross sections that will be calculated.
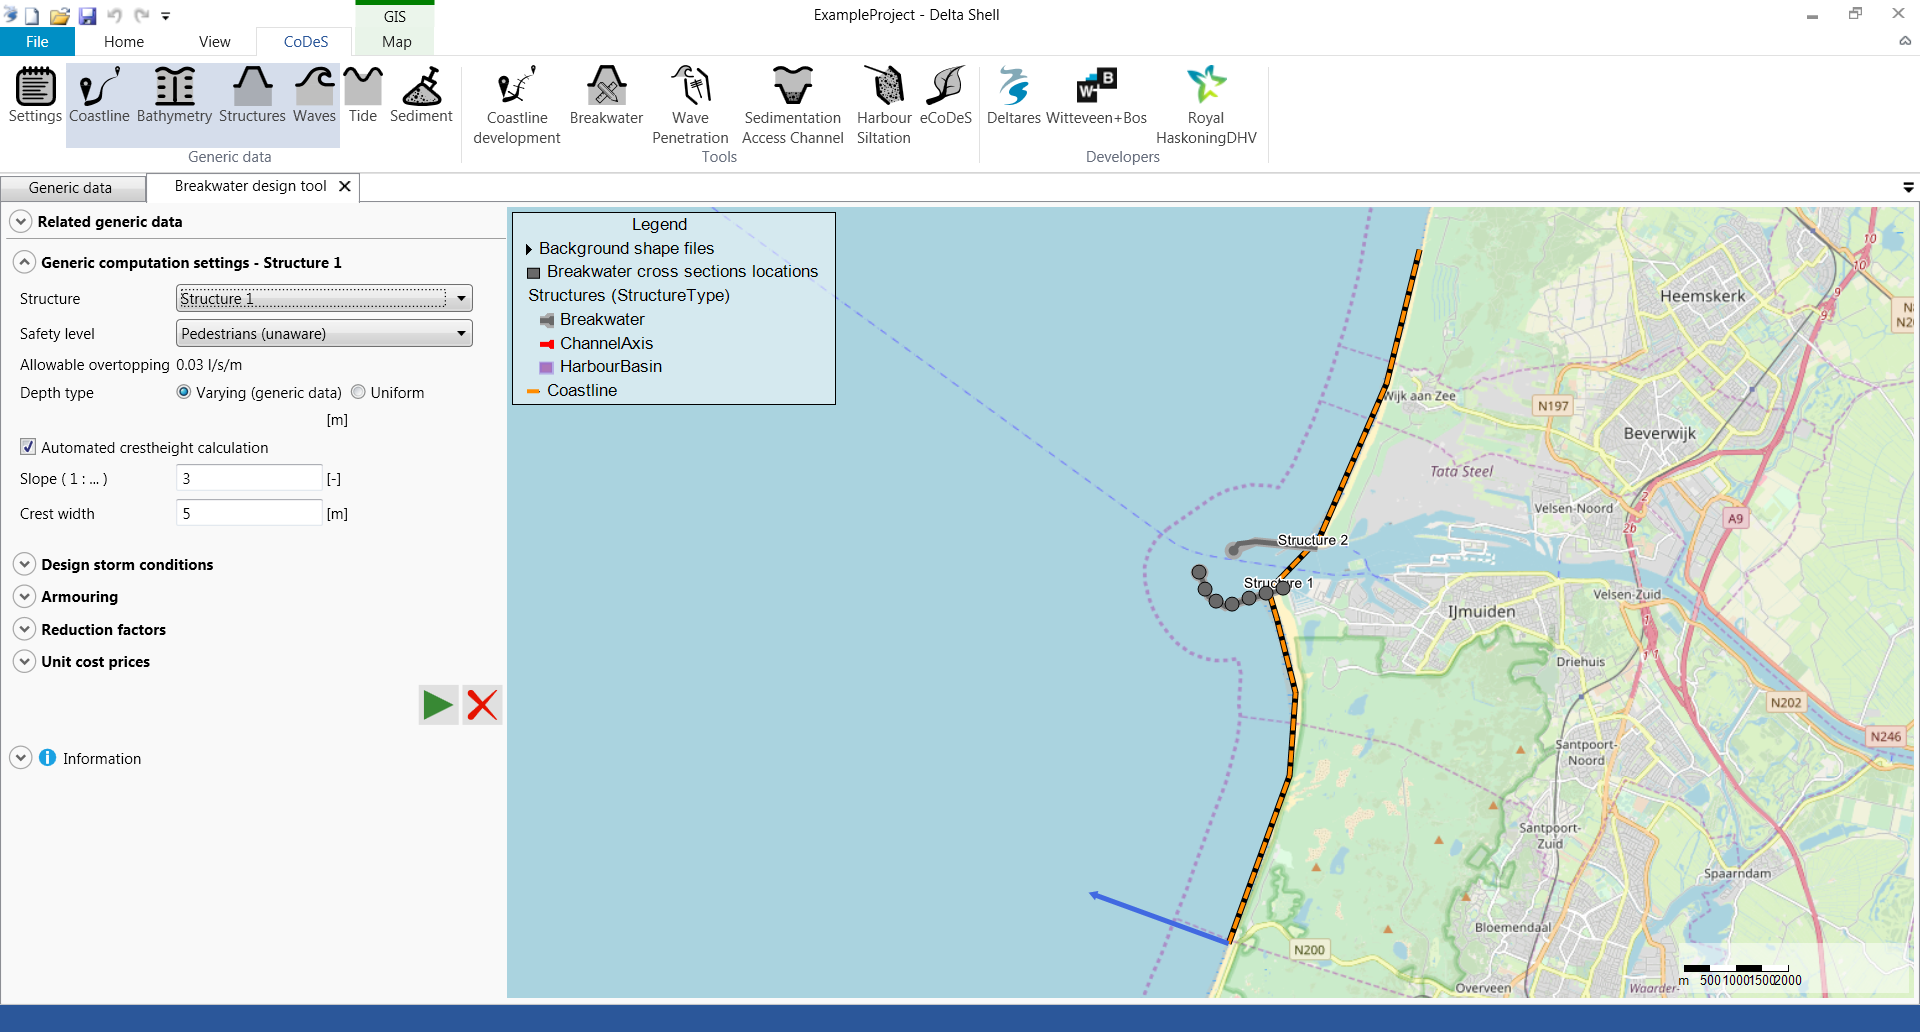
- Press the play button to start the breakwater design calculation.
- After the calculation, subwindows are presented below the map which hold the following information:
- Cross-sectional breakwater design
For each cross-section along the breakwater (indicated by the grey dot), this plot shows the cross-sectional dimensions of the armour, filter and core layer. Also the water level during storm conditions is indicated. The slider below the plots allows for selecting a different cross-section. The cross-sections are numbered in offshore direction.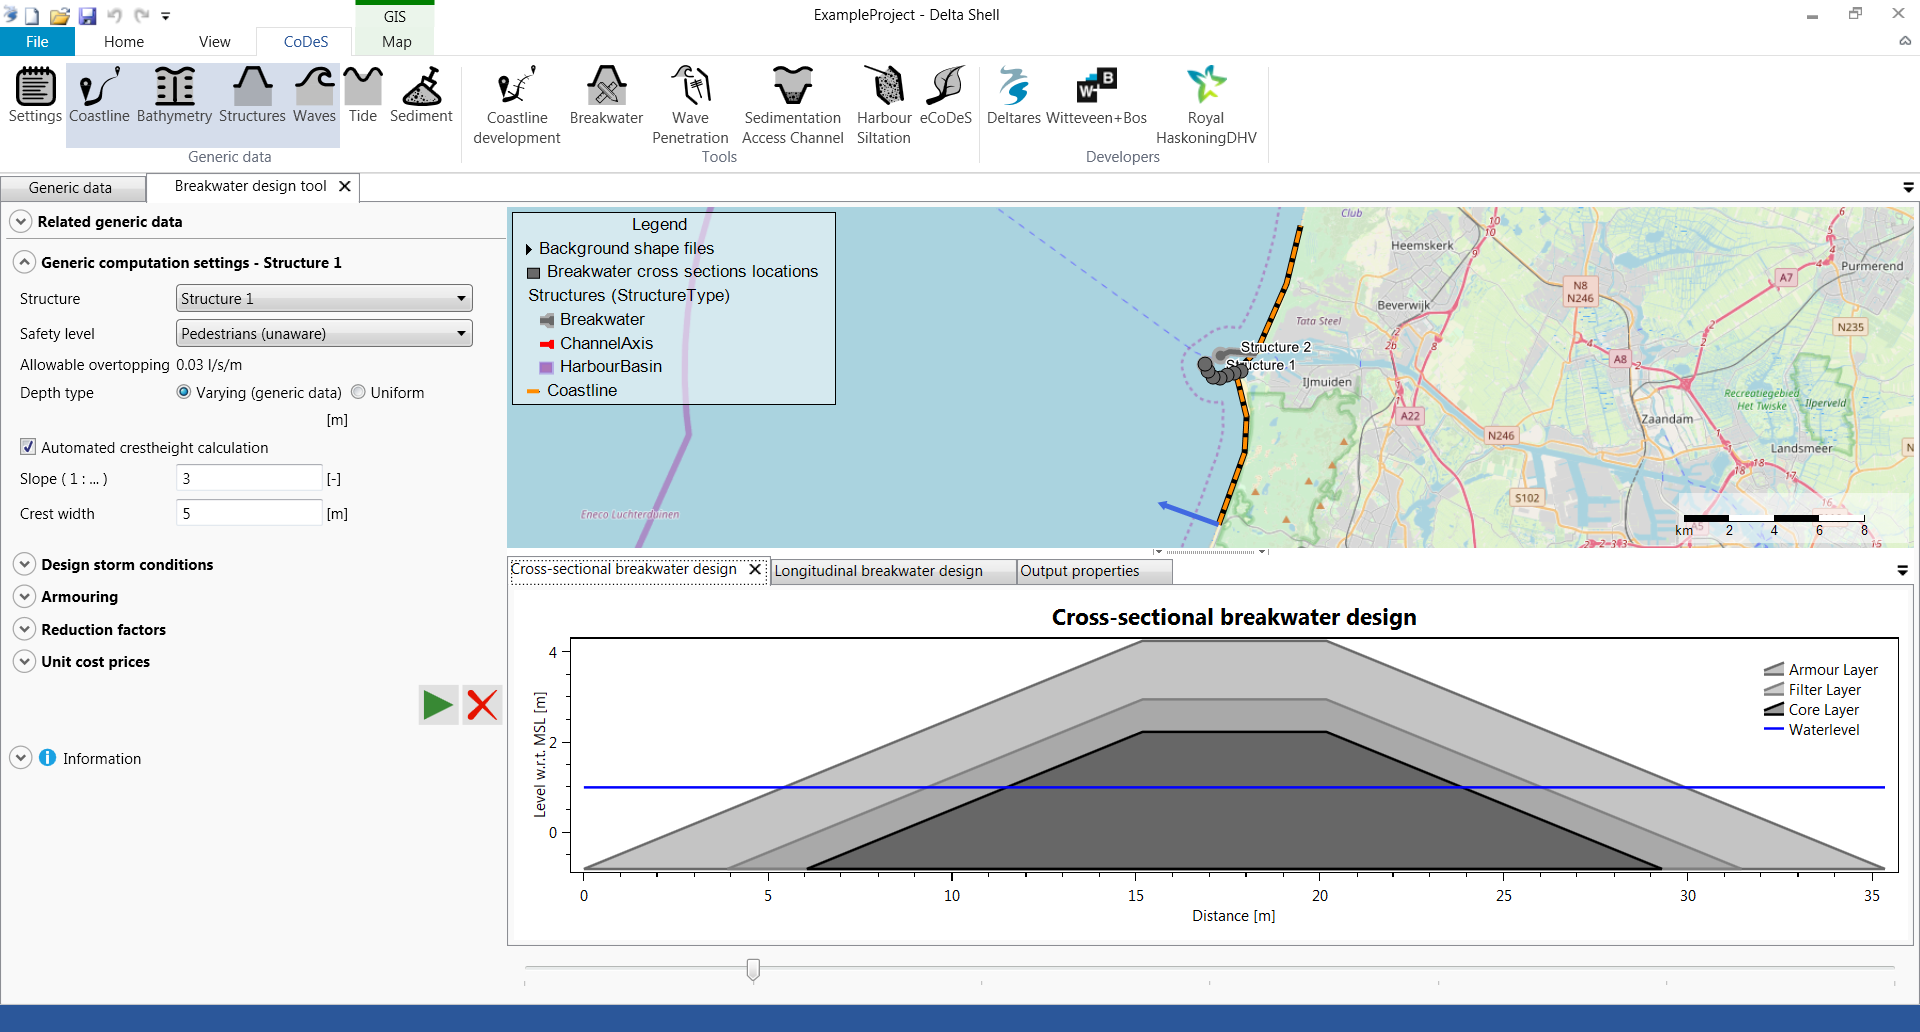
- Longitudinal breakwater design
This plot shows the breakwater dimensions along the breakwater's longitudinal axis. The water level, the depth profile and the crest height are all indicated in this plot. At every cross-section a vertical line is shown, corresponding to the breakwater height at that specific cross-section.
- Output properties
This panel shows a summery of the input and output parameters per cross-section. The slider below the plots allows for selecting a different cross-section.
- Cross-sectional breakwater design
- Press the delete button to delete the output from the map.
User input fields
A number of user input fields are provided which can be used to adjust the calculation according to the local situation. Default values are provided for each input field. The following inputs are defined:
...
| Default Value | Unit | Min. | Max. | Brief Description | |
|---|---|---|---|---|---|
| Location | Offshore | Offshore | Nearshore | Indicate whether the design storm conditions are provided at an offshore or nearshore (at the breakwater toe). Using lineair wave theory the wave height is transformed to nearshore conditions in case offshore storm conditions are provided. | |
| Hs | 3 | m | 0.01 | 20 | Significant wave height during design storm conditions. |
| Tp | 12 | s | 0.01 | 20 | Wave peak period during design storm conditions. |
| Water level | 1 | m, MSL | -10 | 10 | Provide the water level at the tip of the breakwater w.r.t. to MSL that is present during storm conditions. |
| Storm duration | 6 | hr | 0.1 | 48 | Total duration of the storm. This is used to calculate the total number of waves that is expected to reach the breakwater. |
| Breaker parameter | 0.73 | - | 0.0001 | 1 | Defines the wave height at which waves start to break. The maximum wave height is defined by the breaker parameter times the local waterdepth. |
| Offshore depth | 100 | m | 0 | 9999 | In case the design storm conditions are provided at an offshore location, provide the offshore depth of that location. Using lineair wave theory, the wave height is transformed to nearshore conditions. |
...
Unzip the files to an convient folder (but make sure the file structure does not change), and open the .dsproject file from within CoDeS.
| View file | ||||
|---|---|---|---|---|
|