...
Shoreline dynamics are computed through alongshore transport gradients based on shoreline orientation relative to the wave direction. The computation is performed on a staggered 1-dimensional coastline grid. Transport gradients give rise to shoreline position changes, which in turn results in changing alongshore transports in time.
How to use the tool
Text
- Open a new project
- Start in Generic Data by defining a Coastline, a Cross-shore profile (slope) a Wave climate and sediment characteristics.
Please note:- Only the wave climate and not the extreme wave climate is considered in the calculation.
- A nearshore wave climate is calculated based on linear wave theory in case an offshore wave climate is provided.

- If required, define breakwater structures. Make sure the breakwaters intersect the coastline.
- Open the Coastline development tool.
- Provide input according to the description below.
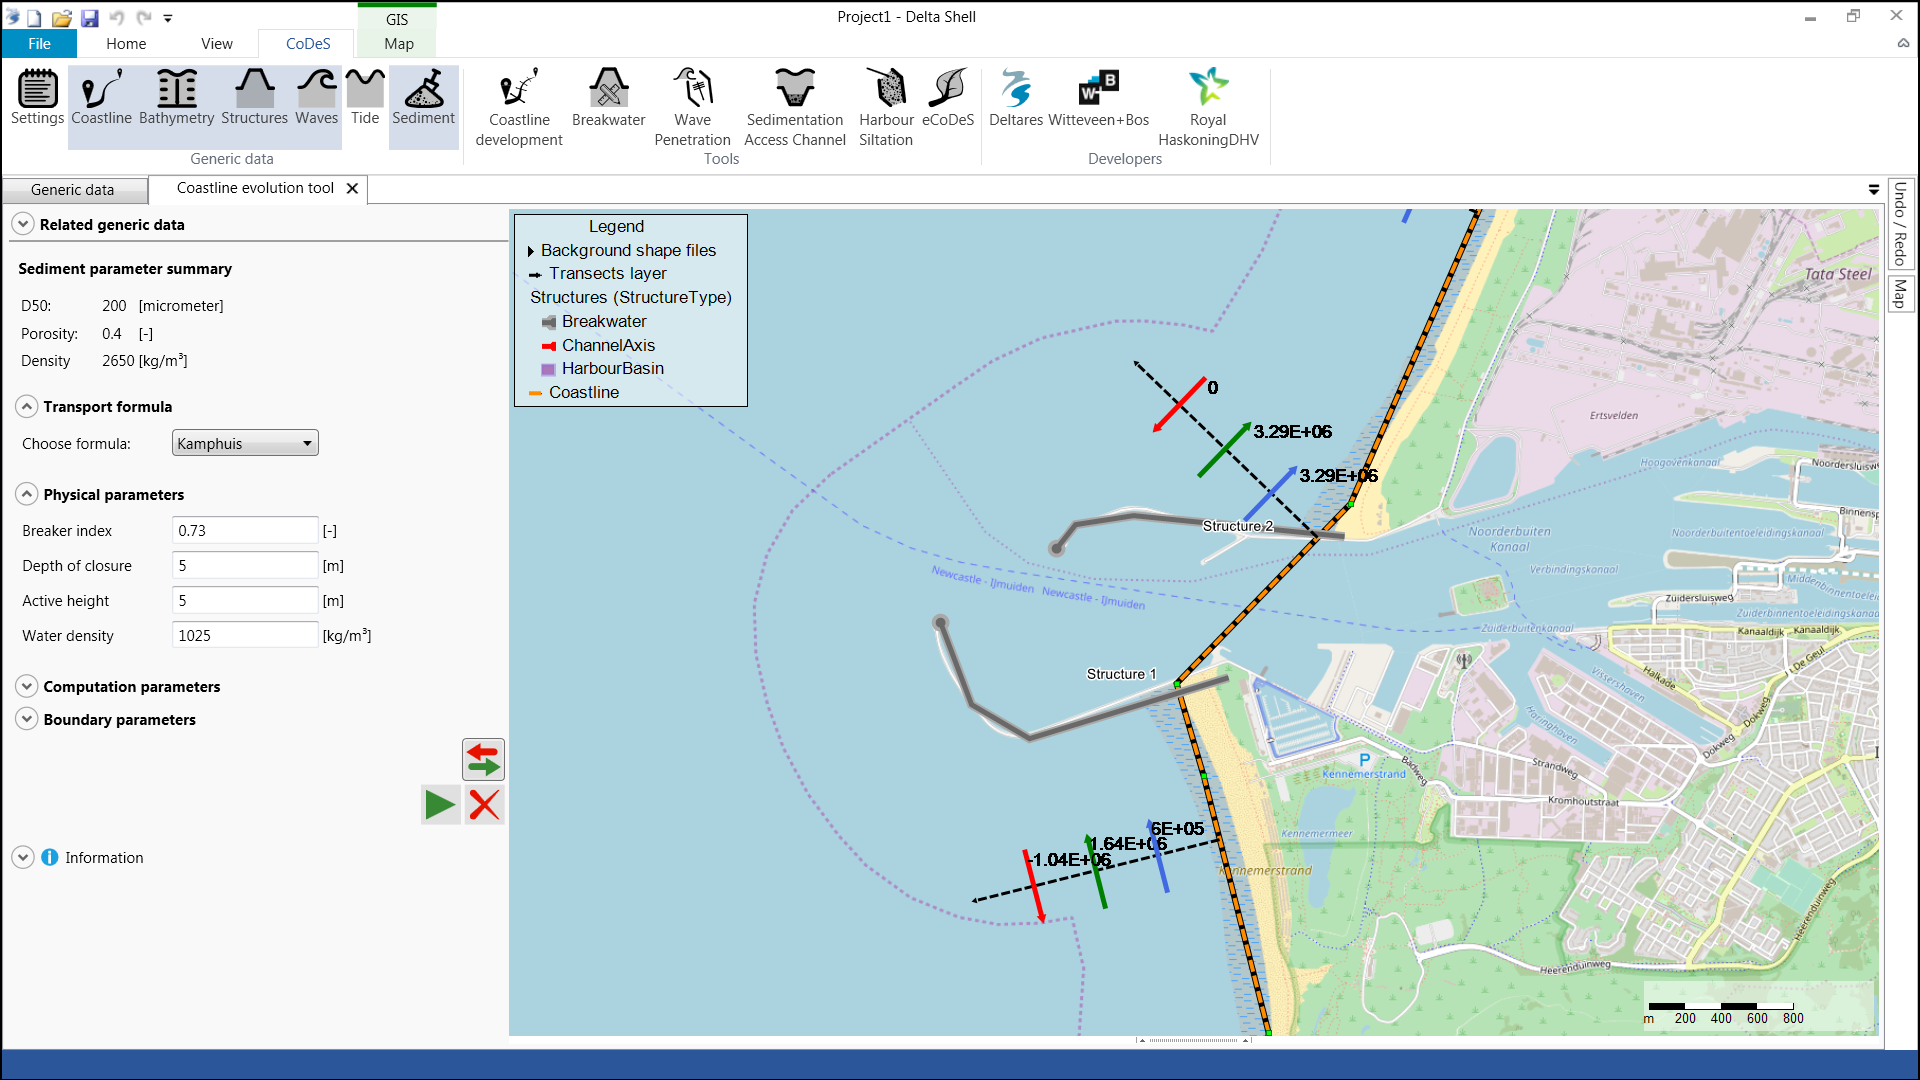 Press the (
 ) button to obtain sediment transport magnitude information along a specified amount of shorenormal transects along the coastline.
- The Red arrow indicates the nett sediment transport magnitude in m3/year at direction at that transect.
- The Green arrow indicates the gross sediment transport from left to right in m3/year at that transect.
- The Blue arrow indicates the gross sediment transport in m3/year from right to left at that transect.
- Press the play button to start the coastline evolution calculation. A shoreline will be plotted on the map for each speficied time interval. An S-phi curve is plotted per wave condition.
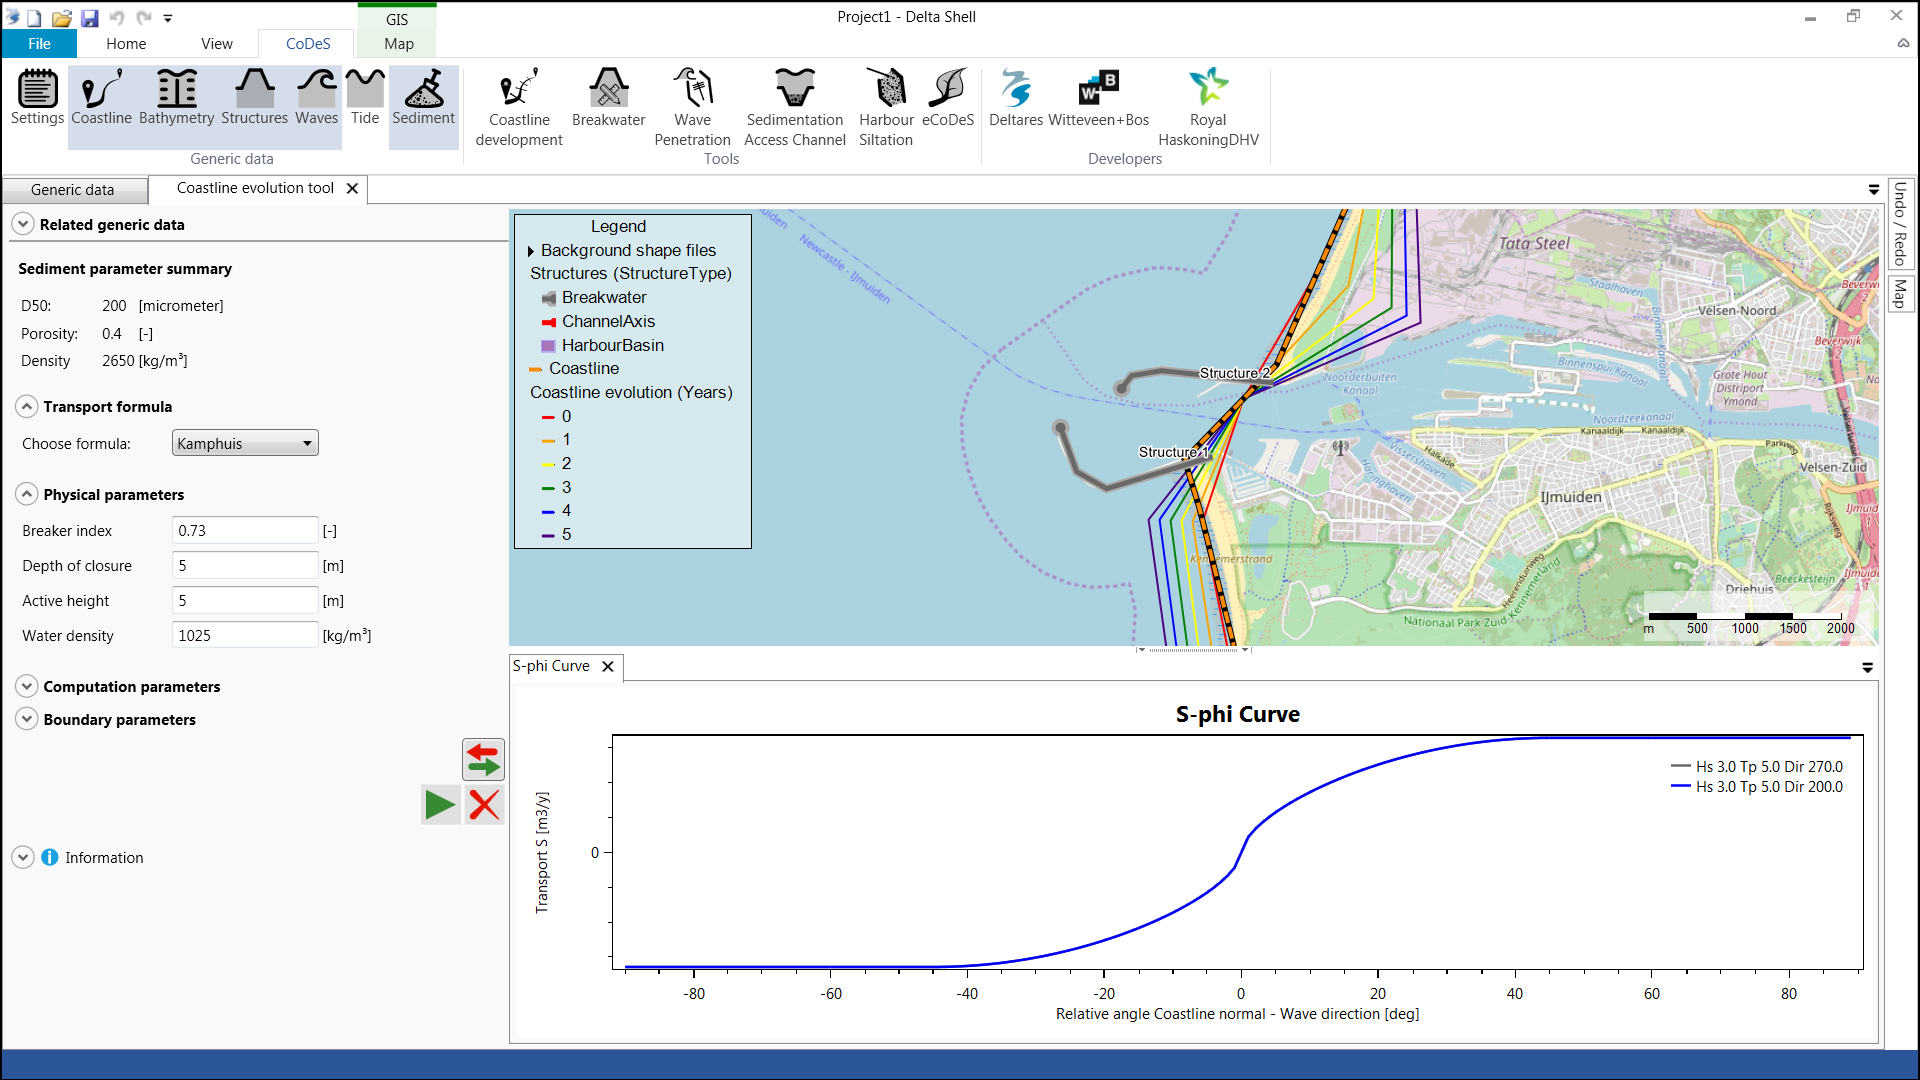
- Press the delete button to delete the coastlines.
Please be aware that the speed of this tool scales:
...
- Left and right boundary - Define the boundary condition applied on the left (closest to the coastline origin/blue arrow) and right boundaries of the staggered grid. You can choose between:
dS = 0 - the sediment transport on the boundary cell equals the sediment transport on the left/right most grid cell.
S = 0 - no sediment transport on the boundary cell.
...