Accessing netCDF/OPeNDAP data with R
Get R, which includes several netCDF4 packages.
| Code Block |
|---|
require(ncdf) |
- Go to an OPeNDAP server (e.g. http://opendap.deltares.nl) and pick a netCDF file by copying the contents of the Data URL box. Because the netcdf packages for windows are not yet opendap-enabled, download them.
- Define the associated url you just copied.
A complete linux image with the R netcdf package compiled with OPeNDAP is available upon request from ""adaguc "at" knmi.nl"".Code Block url_grid <- "http://opendap.deltares.nl/thredds/fileServer/opendap/rijkswaterstaat/vaklodingen/vaklodingenKB116_4544.nc" # note: netcdf4 does not work on windows R url_time <- "http://opendap.deltares.nl/thredds/fileServer/opendap/rijkswaterstaat/waterbase/concentration_of_suspended_matter_in_sea_water/id410-DELFZBTHVN.nc" download.file(url_grid, "vaklodingenKB116_4544.nc", method = "auto", quiet = FALSE, mode="wb", cacheOK = TRUE) download.file(url_time, "id410-DELFZBTHVN.nc", method = "auto", quiet = FALSE, mode="wb", cacheOK = TRUE)
- Extract the data.
Code Block grid.nc <- open.ncdf("vaklodingenKB116_4544.nc") # look what's in there... grid.nc # Get grid data G.x <- get.var.ncdf(grid.nc,'x') G.y <- get.var.ncdf(grid.nc,'y') # get only first timestep G.z <- get.var.ncdf(grid.nc,'z')[,,1] # to get a black background, and set the scale of depth values to start from 0. G.z[G.z == -9999] <- 0 # image.plot needs sorted x- and y-values; # as y-values are descending, the order is reversed here... G.y <- rev(G.y) G.z <- G.z[,length(G.y):1]Code Block time.nc <- open.ncdf("id410-DELFZBTHVN.nc") # look what's in there... time.nc T.t <- get.var.ncdf(time.nc,'time') T.eta <- get.var.ncdf(time.nc,'concentration_of_suspended_matter_in_sea_water') - plot ...
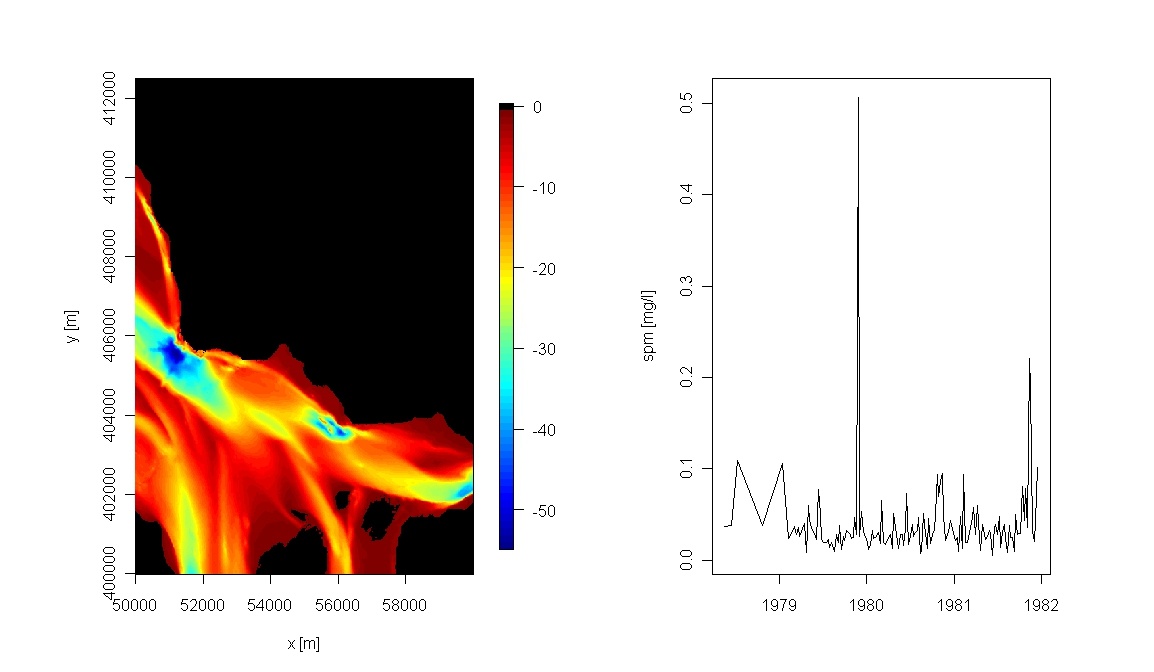
Code Block # R-package fields provides nice image facilities and color schemes par (mfrow = c(1,2)) library(fields) image.plot(G.x,G.y,as.matrix(G.z), col = c(tim.colors(),"black"), xlab = "x [m]", ylab = "y [m]")Code Block plot(as.Date(T.t, origin="1970-01-01"), T.eta, type = "l", ylab = "spm [mg/l]")
- et voila
Download the code of this R example (repos,manual download), which was provided by Karline Soetaert and Tom van Engeland.
See also: Accessing netCDF/OPeNDAP data with python, Accessing netCDF/OPeNDAP data with Matlab, PostgreSQL access with R, OPeNDAP subsetting with R