Accessing netCDF/OPeNDAP data with Python
Get PythonXY, add the netCDF4 package (PythonXY installer). Not all netCDF4 packages have been compiled with opendap yet. Therefore, manually also install the pydap package with easy_install.
| Code Block |
|---|
python # start python in DOS shell to install easy_install >>> from ez_setup import use_setuptools >>> use_setuptools() >>> exit() # now easy_install works outside python easy_install Paste # sometimes Paste is problematic, so let's install itmanually easy_install Pydap |
OpenEarthTools provides a module opendap.py that makes pydap quack like netCDF4 (repos, manual download) so you can talk directly to opendap data via the web. Now execute the following Python lines, or download the full example code (repos,manual download):
| Code Block |
|---|
#!/usr/bin/env python # Read data from an opendap server import netCDF4, pydap, urllib import pylab, matplotlib import numpy as np from opendap import opendap # OpenEarthTools module, see above that makes pypdap quack like netCDF4 |
- Go to an OPeNDAP server (e.g. http://opendap.deltares.nl) and pick a netCDF file by copying the contents of the Data URL box.
- Define the associated url you just copied.
Code Block url_grid = r'http://opendap.deltares.nl/thredds/dodsC/opendap/rijkswaterstaat/vaklodingen/vaklodingenKB116_4544.nc' url_time = r'http://opendap.deltares.nl/thredds/dodsC/opendap/rijkswaterstaat/waterbase/concentration_of_suspended_matter_in_water/id410-DELFZBTHVN.nc'
- Extract the data.
Code Block # Get grid data grid = opendap(url_grid) G_x = grid.variables['x'] G_y = grid.variables['y'] G_z = grid.variables['z'] G = {} # dictionary ~ Matlab struct G['x'] = G_x[:].squeeze() G['y'] = G_y[:].squeeze() G['z'] = G_z[1,:,:].squeeze() # download only one temporal slice # represent fillValue from data as Masked Array # the next release of netcdf4 will return a masked array by default, handling NaNs # correctly too (http://code.google.com/p/netcdf4-python/issues/detail?id=168) G['z'] = np.ma.masked_invalid(G['z'])Code Block # Get time series data time = opendap(url_time) T_t = time.variables['time'] T_z = time.variables['concentration_of_suspended_matter_in_water'] T = {} # dictionary ~ Matlab struct T['t'] = netCDF4.num2date(T_t[:], units=T_t.units) T['z'] = T_z[:].squeeze() - plot ...
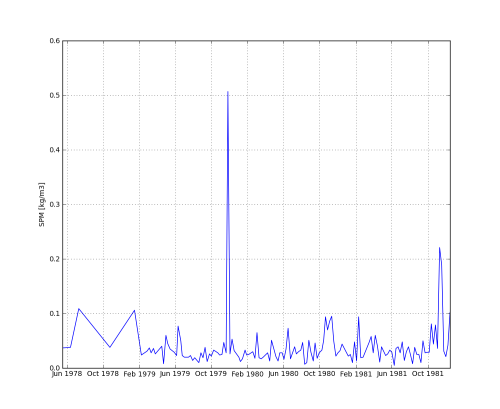
Code Block # plot grid data matplotlib.pyplot.pcolormesh(G['x'],G['y'],G['z']) pylab.xlabel('x [m]') pylab.ylabel('y [m]') matplotlib.pyplot.colorbar() matplotlib.pyplot.axis('tight') matplotlib.pyplot.axis('equal') matplotlib.pyplot.title(url_grid) pylab.savefig('vaklodingenKB116_4544') # plot time series data pylab.clf() matplotlib.pyplot.plot_date(T['t'], T['z'], fmt='b-', xdate=True, ydate=False) pylab.ylabel('SPM [kg/m3]') matplotlib.pyplot.title(url_time) pylab.savefig('DELFZBTHVN') - et voila

Download the code of this python example (repos,manual download) + opendap.py pydap2netCDF4 module (repos, manual download).
See also: OPeNDAP subsetting with python,Accessing netCDF/OPeNDAP unstructured grids with python, Accessing netCDF/OPeNDAP data with R, Accessing netCDF/OPeNDAP data with Matlab, curvilinear model data subsetting with python