Accessing netCDF/OPeNDAP data with Excel
- Go to an OPeNDAP server (e.g. http://opendap.deltares.nl) and pick a netCDF.
Now either 1) Copy the url from the browser and replace *.html with *.asc or 2) copy the url from the Data URL box and append *.asc, e.g.:
Code Block http://opendap.deltares.nl/thredds/dodsC/opendap/rijkswaterstaat/waterbase/concentration_of_suspended_matter_in_sea_water/id410-DELFZBTHVN.nc.asc
- Open Excel
Wiki Markup Choose the open file dialog, and insert the url !OET:OpenEarth123_waterbasexls1.png|width=500pxpxpxpxpxpxpxpxpxpxpxpxpxpxpxpxpxpxpxpxpxpxpxpxpxpxpxpxpxpxpxpx! !OET:OpenEarth123_waterbasexls2.png|width=500pxpxpxpxpxpxpxpxpxpxpxpxpxpxpxpxpxpxpxpxpxpxpxpxpxpxpxpxpxpxpxpx!
Wiki Markup Go through the 3 steps of the import wizard and tick the options for 'comma-separated' values in step 2. For Dutch users also set the decimal separator to a dot (".") (Advanced button in 3rd wizard step). !OET:OpenEarth123_waterbasexls4.png|width=500pxpxpxpxpxpxpxpxpxpxpxpxpxpxpxpxpxpxpxpxpxpxpxpxpxpxpxpxpxpxpxpx!Wiki Markup You now have the data in Excel. !OET:OpenEarth123_waterbasexls5.png|width=500pxpxpxpxpxpxpxpxpxpxpxpxpxpxpxpxpxpxpxpxpxpxpxpxpxpxpxpxpxpxpxpx!
Wiki Markup The OPeNDAP server returns 1D vectors in ascii file as rows. Copy the relevant rows to columns with the menu Edit > "Paste special" choise and tick _Transpose_, see [microsoft help|https://support.office.com/en-us/article/Transpose-rotate-data-from-rows-to-columns-or-vice-versa-3419f2e3-beab-4318-aae5-d0f862209744?ui=en-US&rs=en-US&ad=US]. !OET:OpenEarth123_waterbasexls6.png|width=500pxpxpxpxpxpxpxpxpxpxpxpxpxpxpxpxpxpxpxpxpxpxpxpxpxpxpxpxpxpxpxpx! !OET:OpenEarth123_waterbasexls8.png|width=500pxpxpxpxpxpxpxpxpxpxpxpxpxpxpxpxpxpxpxpxpxpxpxpxpxpxpxpxpxpxpxpx!
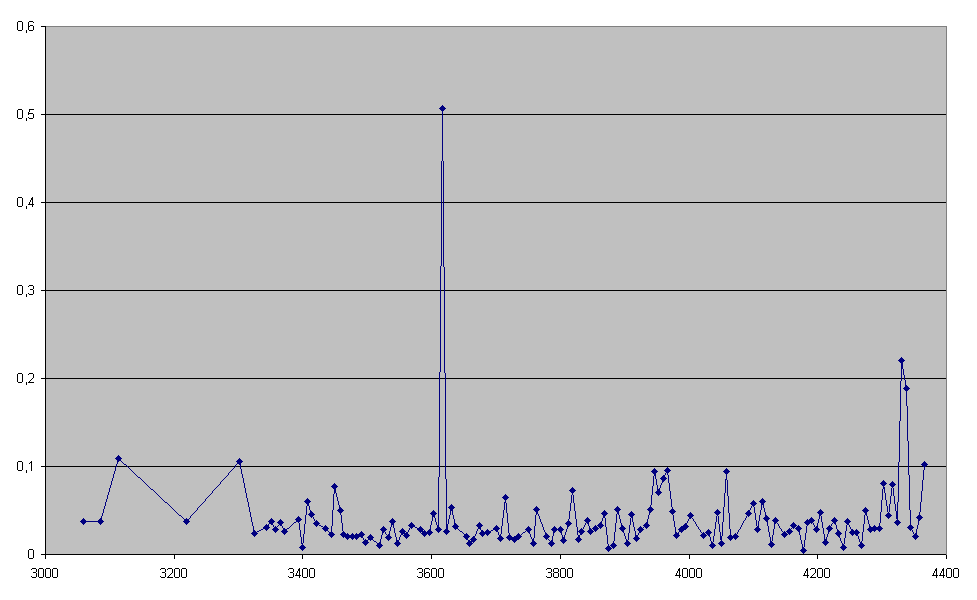
- Now the data is in columns and ready to plot.
See also this.