...
Selecting the small arrow at the right of the icon shows the next menu:

| function | description |
|---|---|
| Validation | shows a separate column with the validation flags |
| Users | shows a separate column with the user names of editted values |
| Comments | shows a separate column with the comments |
| Units | shows in the header the unit of the parameter |
| Location Names | shows in the header the location name |
| Location Ids | shows in the header the location ID |
| Module | shows in the header the moduleInstanceId |
| Column statistics | shows between the header and the table statistics of the values in the current relativeViewPeriod, like mean, sum, min, max |
| Threshold crossing | shows in the cells (on the left side) a small bar with a color according to the threshold definition, that indicates a threshold crossing |
| Normal | shows the values in a normal table, so all times have a row |
| Days | shows the values in an aggregated way, so that each day gets its own column. Usefull to series with for example an hourly time step. |
| Weeks | shows the values in an aggregated way, so that each week gets its own column. Usefull to series with for example a daily time step. |
| Months | shows the values in an aggregated way, so that each month gets its own column. Usefull to series with for example daily time step. |
| Years | shows the values in an aggregated way, so that each year gets its own column. Usefull to series with for example monthly time step. |
| Show empty RVP series | shows/hides the series which are empty in the current viewperiod. Usefull while using shortcuts or thumbnails. |
| Show empty complete series | shows/hides the series which are completely empty. Usefull while using shortcuts or thumbnails. |
| Time order reversed | Shows the times in reversed order, so from new to old |
 Shortcuts
Display templates are available for rapid assessment of data. The templates can be activated by clicking the above mentioned button. The left side of the display shows the available shortcuts in a pre-configured grouping.
...
By clicking this button there will be no scaling in order to show threshold thresholds out of data range.
 Scale to show relevant Thresholds
...
- the middle line indicates the quality of the data
- reliable data: no line is displayed
- doubtful data: light yelloworange
- unreliable data: dark yellow
- the lower line indicates where comments have been added to the data
- no comment: no line is displayed
- comment available: dark red
...
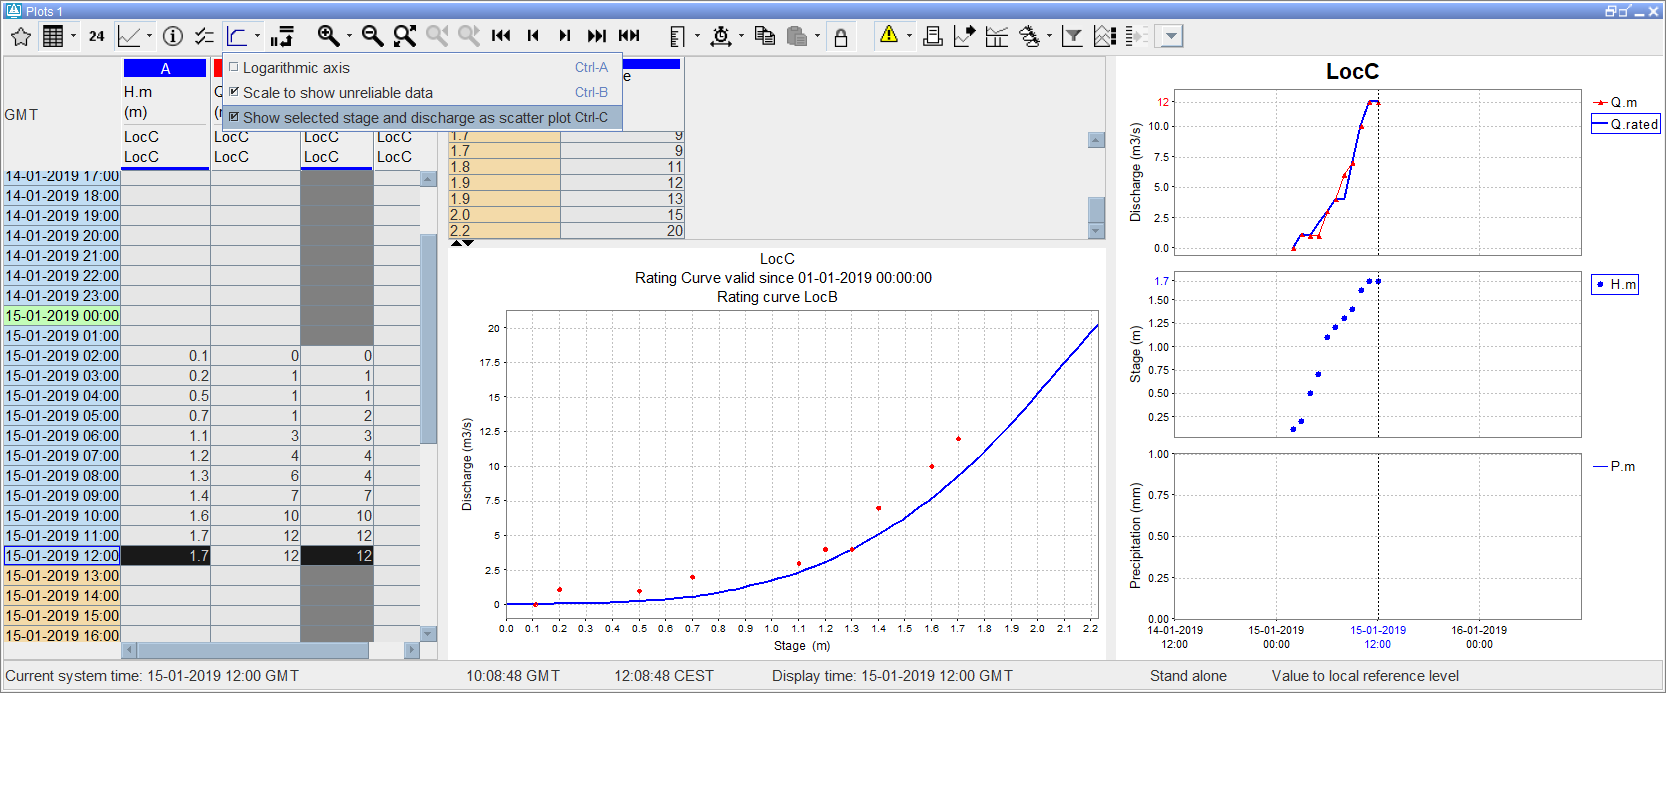
The display offers also the opportunity to show rating curves. In such graph, the rating curve stage values are plotted against discharge values. By default stage is shown on the Y-axis and discharge on the X-axis. Configure stageAxisOrientation ‘horizontal’ in TimeSeriesDisplay config if the axes should be switched. Rating curve display shows the rating curve that belongs to the location selected in the table or in the chart legend. If this location has multiple rating curves with different qualifiers, rating display shows a list where the specific rating curve can be selected

Displaying
...
gaugings along with the rating curves
Since release 2019.02 it is possible to display observations display gaugings (observations of level and discharge (velocity) combinations) along with the rating curve. To show the observations in rating curve display, follow these steps:
- open TimeSeriesDialog with the time series you want to see along with the rating curve,
- open rating curve display for required location,
- select option “Show selected stage and discharge as scatter plot” from the drop down menu of the button “ Rating Curves” (on the TSD toolbar),
- select one stage series and one discharge series from the time series table or from the chart legend. The selected series will be shown as scatter plot along the rating curve. All values in the chart zoom period will be displayed. The number of values shown can be changed by changing of the zoom period.
Note that the selected series must be stage and discharge, it means the series parameter must be from the same parameter group as the rating curve parameters configured in Parameters.xml. Other series selection will be ignored.
Category plot
| Note |
|---|
This graph type is available in DELFT-FEWS versions 2011.01 and higher. |
...