uvAmplitudeParameterId
Grid display
The grid display is used in DELFT-FEWS for viewing grid time series. These grid time series can be dynamically animated against a map background (comparable to the main map display).
The Id of the grid display is identified in the DisplayInstanceDescriptors. When available on the file system, the name of the XML file for configuring the GridDisplay with an Id of FloodMapDisplay is for example:
FloodMapDisplay 1.00 default.xml
FloodMapDisplay | File name for the Flood Map display configuration |
1.00 | Version number |
default | Flag to indicate the version is the default configuration (otherwise omitted). |

Figure 143 Example of a configuration of the Grid Display
Besides plotting a grid in the grid display, it is also possible to plot scalar data (Figure 10) and longitudinal profiles (figure 9).
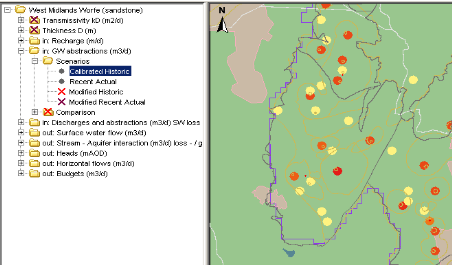
Figure 010 Example of a configuration of the scalar data in Grid Display

Figure 009 Example of a configuration of the longprofile in Grid Display

Figure 144 Root elements of the gridDisplay configuration
title
Name of the Grid Display. When opened this will appear in the title bar of the window.
gridPlotGroup
Definition of a group in the grid display. Each group may have its own set of maps and time series to display. Defining groups creates a tree view in the left of the display (see example above). Multiple instances may exist.
Attributes;
- id : Id of the display group- this is used in the tree view.
- name : Optional name of the display group- used for reference purposes only
description
Optional description of the display group/grid plot. Used for reference purposes only
highlight
Optional property to highlight the Group name in bold in the selection filter.
gridPlot
Definition of a grid plot within the display group. Each grid plot forms a node in the tree view. When a gridPlot is selected, the appropriate maps will be displayed and the time series data retrieved from the database.
Attributes;
- id : Id of the grid plot- this is used in the tree view.
- name : Optional name of the grid plot- used for reference purposes only
- contourlinescolor: required when the "contourlines button" in the griddisplay should be enabled
timeSeriesSet
Definition of the time series set to be displayed in the selected grid plot. This can refer to one location with valuetype grid or longitudinal profile, or it can refer to a locationSet of scalars. Contourlines can only be displayed in combination with a regular grid.
legendStyle
The legend can be shown as table legend or as bar legend.
Default legend style is table. Bar legend shows fluent scale bar on the right.
barLegend
Use this element to show customized bar legend.
The following legend properties can be changed:
- position: legend can be placed on the right, on the left, at the top or at the bottom. Default is on the right.
- width: width of the bar in pixels. Default is 40 pixels.
- length: length of the bar in pixels. The defaults are 400 for legend on the right/left, and for the legend at the top/bottom the length equals the width of the window
- labelsInside: if true , ticks and labels are displayed inside the legend bar . The default is outside.
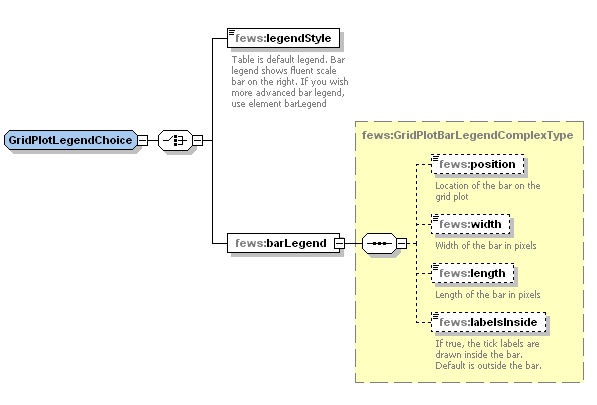
Elements of the configuration of legend style
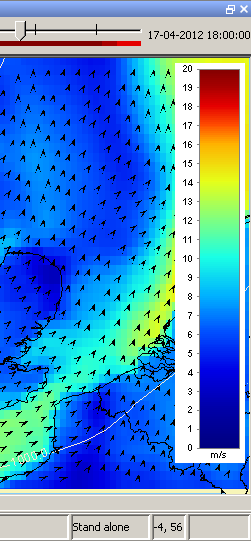
uTimeSeriesSet/vTimeSeriesSet
When data with velocities are available as a timeseries with the u-component and the v-component, these can be placed in the uTimeSeriesSet and vTimeSeriesSet elements. In the grid display automatically arrows will be drawn showing the direction, calculated on the v and u component. The velocity is presented in a color, defined in the classBreaks.
Double clicking in the grid display will open the u and v timeseries in the timeseries display. If one of the following is configured, they will be opened instead:
- Adding the uvAmplitudeParameterId element (since 2015.02), where an amplitude parameter can be configured, the timeseries display will combine the u and v timeseries into one amplitude timeseries (sqrt(u^2+v^2)).
- Adding the uvDirectionParameterId element (since 2016.01), where a wind direction parameter can be configured, the timeseries display will combine the u and v timeseries into one wind direction timeseries. The wind direction is in degrees, where the north direction is 360 degrees, east is 90 degrees, south is 180 degrees and west is 270 degrees.
DirectionTimeSeriesSet
If a timeserie with direction data is available, this is where the TimeSeriesSet should be placed. Note: a TimeSeriesSet with velocity values is required in the ValueTimeSeriesSet!
classBreaks
Definition of colours to use in displaying the dynamic grid. These are also shown in the legend on the left of the grid display (see example above). Optional when default class breaks are available for this plot group and parameter group. Note: the missingValueColor configured in this classBreaks element is also used to display missing values (NaN values) for point locations and tracks when the display is showing threshold warning level flags.
missingValueColor: Color that is used to display missing values (NaN values) for point locations and tracks. Default is fully transparant.
missingValueOpaquenessPercentage: Opaqueness percentage that is used to display missing values (NaN values) for point locations and tracks. This overrules the opaqueness of the configured missingValueColor. If missingValueOpaquenessPercentage is not configured, then opaqueness of missingValueColor is used.
geoMap
Definition of the maps used as a background to the dynamic grid displayed. The layout and zoom extent are also defined in this element.
Definition of class breaks

Figure 145 Elements of the configuration of class breaks
description
Optional description. Since FEWS 2017.01 it is allowed to have multiple class breaks for a plot. The user can switch between the class breaks with a drop down list. This description is used in the drop down list.
missingValueColor
Not implemented yet.
missingValueOpaqueness
Not implemented yet.
unitVisible (available since build 18734)
When this is true the display unit for the class break values will be displayed in the legend. Default is false. The display unit can be configured in parameter group.
rescaleAroundOrdinalValue (available since build 17892)
Definition of the optional ordinal value that will always keep the same colour when the class break colours are rescaled in the grid display. After rescaling, the highest lowerValue will be changed to the maximum grid value visible in the current zoom extent and the lowest lowerValue will be changed to the minimum grid value visible in the current zoom extent. The lowerValues and the colours in between will be rearranged to fit between the minimum and maximum. Thus the colours for given values change.
If no ordinal value is specified, then the colours are just rearranged. However, if e.g. ordinal value = 0 is specified and 0 values have a white colour, then the rescaling will take this into account so that 0 values always stay coloured white. This can be used for instance when displaying temperatures, where red colours are used for positive values and blue colours are used for negative values and zero values are coloured white.
lowerColor
Colour definition for the colour in the legend associated with the lowest value in the range.
upperColor
Colour definition for the colour in the legend associated with the highest value in the range.
lowerOpaquenessPercentage
Optional definition of the opaqueness of the colour in the legend associated with the lowest value in the range.
upperOpaquenessPercentage
Optional definition of the opaqueness of the colour in the legend associated with the highest value in the range.
lowerSymbolSize
Optional definition of the size of symbols associated with the lowest value in the range.
upperSymbolSize
Optional definition of the size of symbols associated with the highest value in the range.
lowerValue
Definition of the value at which the colour in the grid displayed changes. The legend will be a gradual change in colours from the lowest colour to the highest colour, with the number of increments determined by the number of lowerValue items entered. Multiple entries may exist.
color
Deprecated, use break.
break
The options described above can be used for definitions of lowerValues that have colors that change gradually between a lowerColor and upperColor. The break option can be used instead for specifying a discrete lowerValue with an absolute color, symbolSize and opaquenessPercentage. Multiple entries may exist.
Definition of background maps
The background maps to be displayed are defined in the geoMap element. This is an XML implementation of the OpenMap configuration described also in Appendix C for configuring the main map display (in time this will also be done using the geoMap element).

Figure 146 Elements of the geoMap configuration
The more advanced options are described below. Rather straightforward options like northArrowVisible are self explaining.
description
Optional description of the configuration. Used for reference purposes only.
extents
Root element for the definition of a zoom extent. The extents defined will appear in a drop down list in the grid display.
geoDatum
Coordinate system the extents are defined in. Enumeration of available coordinate systems is available in Appendix B.
defaultExtent
Definition of the default zoom extent.
Attributes;
- name : name of the default zoom extent (displayed in the drop-down list)
extraExtent
Definition of the additional zoom extents. Multiple entries may exist.
Attributes;
- name : name of the zoom extent (displayed in the drop-down list)
left, right, top, bottom
Coordinates of the zoom extent. Note that in displaying the maps for the extent defined, the map display will be scaled to fit the extent in the current display window.
wfsConnection

Notice that you need to specify a mapLayersCacheDir in the global.properties, like mapLayersCacheDir=%REGION_HOME%/MapCache
More info on connection to ArcSDE and WFS can be found here.
arcSdeConnection

Notice that you need to specify a mapLayersCacheDir in the global.properties, like mapLayersCacheDir=%REGION_HOME%/MapCache
More info on connection to ArcSDE and WFS can be found here.
serverShapeLayer
To make use of a Wfs or ArcSDE connection you have to use the option for serverShapeLayer.
This layer supports some extra shape layer elements:
- visible: Controls if the layer is automatically visible. When false the user has to switch on the layer manually. By default the layer becomes automatically visible
- usedBySelectByMapItemTool: Controls if the layer is used by the "Select by map item tool" in the FEWS explorer to easily select all locations in a polygon.
selectByMapItemLocationRelation: When this element is specified an location relation is used to find locations at the map instead of the polygon border.
selectByMapItemAttributeEquals: When this element is specified a (multivalued) location attribute is used to find locations at the map instead of the polygon border.

openStreetMapLayer
To make use of a server that uses the open street map protocol
<openStreetMapLayer id="Osm">
<url>http://tile.openstreetmap.yourserver.com</url>
<cacheDir>$REGION_HOME$/OsmTiles</cacheDir>
</openStreetMapLayer>
For testing purposes you can use "http://tile.openstreetmap.org"
wmsLayer
To make use of a WMS server you have to use the option for wmsLayer.
- url : Base url for the wms server. This is everything before the text "VERSION=" in the url. Use & to include a &
- layer name : Layer name to display. It's the part after the text "LAYERS=" till the next & or ; in the url. To find the layer names enter the url that ends withs "request=GetCapabilities" in a browser.
<wmsLayer id="aerial">
    <url>http://gdsc.nlr.nl/wms/lufo2005?</url>
	<wmsLayerName>lufo2005-1m</wmsLayerName>
	<cacheDir>$REGION_HOME$/wms_areal_cache</cacheDir>
</wmsLayer>
<wmsLayer id="meteosat"> <url>http://geoservices.knmi.nl/cgi-bin/METEOSAT9_DEMO.cgi?&SERVICE=WMS&</url> <wmsLayerName>IR108</wmsLayerName> <cacheDir>$REGION_HOME$/wms_meteosat_cache</cacheDir> </wmsLayer>
<wmsLayer id="HIRMLAM temperature">
<url>http://geoservices.knmi.nl/cgi-bin/HIRLAM_DEMO.cgi?&SERVICE=WMS&</url>
<wmsLayerName>2011-05-26T18:00:00Z/HIRLAM-temp/HIRLAM-temp-2m</wmsLayerName>
<cacheDir>$REGION_HOME$/wms_hirlam_cache</cacheDir>
</wmsLayer>
<wmsLayer id="ahn2"> <url>http://geodata.nationaalgeoregister.nl/ahn2/wms?service=wms&request=getcapabilities</url> <wmsLayerName>ahn2_5m</wmsLayerName> <cacheDir>$REGION_HOME$/ahn2_5m</cacheDir> </wmsLayer>
esriShapeLayer
This layer supports some extra shape layer elements. See the serverShapLayer for a description.

In this section the location of the background shape file can be defined.
- id : Id of the background map
- describtion : optional name of the backgroundmap
- file: path to the shape file
- visible: whether the layer is visible (true or false)
- tooltip : information that is displayed when the user is moving the mouse cursor over a shape. To see this information turn on the 'Information' button.
- lineColor : color of the line
- fillColor : color of the area
- opaquenessPercentage: percentage of opaqueness.
- lineWidth : width of the line
- pointSize or pointIconId: allow size adjustment of points in an ESRI shape-layer, resp. displays an icon (as defined in LocationIcons.xml) at the points in the ESRI shapelayer (Notice: add filename extension!)
An example of the various options, that can be completely mixed is shown in the below picture.

coverageTileArchiveLayer
Since 2013.01 FEWS enables using a compressed grid file for your DEM. The compression is done per scale and in tiles and archived in a zip file, pretty similar as openStreetMap works.
You can prepare a CTA (coverage tile archive) with the F12 menu in the explorer (F12 -> convert -> convert ascii grid to coverage tile archive).
As the resulting file should be in meters (see below why) you may need to specify a conversion factor from eg. centimeter to meter. You can also define an accuracy of the compressed values. Normally centimeter accuracy is more than enough, sometimes you can easily go to decimeters, which compresses much better of course. For synchronization reasons you may want to split the resulting file in parts of e.g. max 2 GB. Usually this is more than enough. The resulting compression is generally a factor of about 10-20. But the main reason is the much better performance of the GUI as per pixel is already determined which value should be plotted.
A very useful additional feature (to be used in the griddisplay only) is the feature that you can use the CTA as a real DEM and use it for plotting of water depths.
You then can easily display the water depths per pixel, based on a time series with water levels (using global datum!) and the DEM in the CTA. Therefore, enable the property useAsLocalDatumReference. Note, usesDatum in Parameters.xml for the respective parameterGroup should be set "true". The waterlevels can have any spatial distribution, like grid or polygon and should not have the exact same grid definition as the DEM. The calculation of the depths is completely on the fly and no depths have to be stored in the database.
<coverageTileArchiveLayer id="asc">
  <file>petten.cta</file>
  <visible>false</visible>
  <useAsLocalDatumReference>false</useAsLocalDatumReference>
  <classBreaks>
    <lowerColor>brown</lowerColor>
    <upperColor>green</upperColor>
    <lowerValue>-4</lowerValue>
    lowerValue>-1</lowerValue>
  </classBreaks>
</coverageTileArchiveLayer>
<gridPlot id="Petten">
  <timeSeriesSet>
    <moduleInstanceId>Floodmap</moduleInstanceId>
    <valueType>grid</valueType>
    <parameterId>H.sim.hist</parameterId>
    <locationId>Floodmap_grid</locationId>
    <timeSeriesType>simulated historical</timeSeriesType>
    <timeStep unit="minute" multiplier="1"/>
    <readWriteMode>read only</readWriteMode>
  </timeSeriesSet>
  <classBreaks>
    <break lowerValue="0" color="light blue" opaquenessPercentage="25"/>
    <break lowerValue="1" color="blue" opaquenessPercentage="75"/>
    <break lowerValue="2" color="purple" opaquenessPercentage="75"/>
  </classBreaks>
  <geoMap>
    <geoDatum>Rijks Driehoekstelsel</geoDatum>
    <projection>mercator</projection>
    <defaultExtent id="Petten testmodel">
      <left>-1000</left>
      <right>10000</right>
      <top>4000</top>
      <bottom>0</bottom>
    </defaultExtent>
    <extraExtent id="Nederland">
      <left>-200000</left>
      <right>500000</right>
      <top>750000</top>
      <bottom>200000</bottom>
    </extraExtent>
    <scaleBarVisible>true</scaleBarVisible>
    <northArrowVisible>true</northArrowVisible>
    <labelsVisible>true</labelsVisible>
    <backgroundColor>light blue1</backgroundColor>
    <openStreetMapLayer id="osm" name="Open Street Map">
      <url>http://tile.openstreetmap.org</url>
      <cacheDir>$MAP_CACHE$/openstreetmaps</cacheDir>
    </openStreetMapLayer>
    <coverageTileArchiveLayer id="asc">
      <file>petten.cta</file>
      <visible>false</visible>
      <useAsLocalDatumReference>true</useAsLocalDatumReference>
      <classBreaks>
        <lowerColor>brown</lowerColor>
        <upperColor>green</upperColor>
        <lowerValue>-4</lowerValue>
        <lowerValue>-1</lowerValue>
      </classBreaks>
    </coverageTileArchiveLayer>
  </geoMap>
</gridPlot>
layer
Definition of a GIS layer to be displayed.
Attributes;
- id : required id of the map layer- must be unique for the current geoMap element.
- name : optional name of the map layer defined
description
Optional description of the map layer. Used for reference purposes only.
className
Name of the class used in displaying the map layer. A different class is required for different types of GIS data.
NOTE: Defining a class name allows advanced users to add additional display functionality to the OpenMap utility, and this being used in map displays in DELFT-FEWS. See the OpenMap documentation for details on how to add additional display classes.
visible
Boolean flag indicating if layer is visible by default.
properties
Definition of properties associated with the map layer to be displayed. Properties that need to be defined depend on the class used. At least one property must be defined. This may be a dummy property. Multiple entries may exist.
string
Definition of a string property. An example is the definition of the geoDatum for displaying shape files using the geoDatumDisplay class.
key
Key to identify the property
Value
Value of the property defined.
Note: when displaying a shape file layer that does not use WGS 1984 as the coordinate system, a property must be defined that defines the geo datum. To do this set the key value as "geoDatum" and define the coordinate system using the enumeration in Appendix B.
See below some examples of nice tile layers below. See also http://server.arcgisonline.com/ArcGIS/rest/services/
<layer id="World" name="ArcGIS World_Topo_Map">
  <className>nl.wldelft.libx.openmap.GenericTileServerLayer</className>
  <properties>
    <string key="tileUrlPattern" value="http://server.arcgisonline.com/ArcGIS/rest/services/World_Topo_Map/MapServer/tile/%ZOOM%/%ROW%/%COLUMN%"/>
    <string key="cacheDir" value="%REGION_HOME%/mapcache/Esri_topo"/>
    <int key="minZoomLevel" value="1"/>
    <int key="maxZoomLevel" value="19"/>
    <int key="topZoomLevel" value="21"/>
    <int key="tileSize" value="256"/>
  </properties>
</layer>

<layer id="Canvas" name="ArcGIS Canvas World_Light_Gray_Base">
  <className>nl.wldelft.libx.openmap.GenericTileServerLayer</className>
  <properties>
    <string key="tileUrlPattern" value="http://server.arcgisonline.com/arcgis/rest/services/Canvas/World_Light_Gray_Base/MapServer/tile/%ZOOM%/%ROW%/%COLUMN%"/>
    <string key="cacheDir" value="%REGION_HOME%/mapcache/Esri_Canvas_World_Light_Gray_Base"/>
    <int key="minZoomLevel" value="1"/>
    <int key="maxZoomLevel" value="19"/>
    <int key="topZoomLevel" value="21"/>
    <int key="tileSize" value="256"/>
  </properties>
</layer>

<openStreetMapLayer id="Osm" name="Open Street Map">
  <url>http://tile.openstreetmap.org</url>
  <cacheDir>$REGION_HOME$/OsmTiles</cacheDir>
</openStreetMapLayer>

<openStreetMapLayer id="Osm" name="Open Street Map (Toner)">
  <url>http://tile.stamen.com/toner</url>
  <cacheDir>$REGION_HOME$/mapcache/stamen_toner</cacheDir>
</openStreetMapLayer>
Configuration (Example)
The following example shows how to configure a Meteosat image as grayScaleImage in the Grid display.
<gridPlotGroup id="Meteosat Images">
	<gridPlot id="MeteoSat">
		<timeSeriesSet>
			<moduleInstanceId>ImportMeteosat</moduleInstanceId>
			<valueType>grid</valueType>
			<parameterId>image</parameterId>
			<locationId>meteosat</locationId>
			<timeSeriesType>external historical</timeSeriesType>
			<timeStep unit="minute" multiplier="15"/>
			<relativeViewPeriod unit="hour" start="-12" end="36"/>
			<readWriteMode>read only</readWriteMode>
		</timeSeriesSet>
		<classBreaks>
			<lowerColor>black</lowerColor>
			<upperColor>white</upperColor>
			<lowerValue>0</lowerValue>
			<lowerValue>8</lowerValue>
			<lowerValue>16</lowerValue>
			<lowerValue>24</lowerValue>
			<lowerValue>32</lowerValue>
			<lowerValue>40</lowerValue>
			<lowerValue>48</lowerValue>
			<lowerValue>56</lowerValue>
			<lowerValue>64</lowerValue>
			<lowerValue>72</lowerValue>
			<lowerValue>80</lowerValue>
			<lowerValue>88</lowerValue>
			<lowerValue>96</lowerValue>
			<lowerValue>104</lowerValue>
			<lowerValue>112</lowerValue>
			<lowerValue>120</lowerValue>
			<lowerValue>128</lowerValue>
			<lowerValue>136</lowerValue>
			<lowerValue>144</lowerValue>
			<lowerValue>152</lowerValue>
			<lowerValue>160</lowerValue>
			<lowerValue>168</lowerValue>
			<lowerValue>176</lowerValue>
			<lowerValue>184</lowerValue>
			<lowerValue>192</lowerValue>
			<lowerValue>200</lowerValue>
			<lowerValue>208</lowerValue>
			<lowerValue>216</lowerValue>
			<lowerValue>224</lowerValue>
			<lowerValue>232</lowerValue>
			<lowerColor>orange</lowerColor>
			<upperColor>red</upperColor>
			<lowerValue>240</lowerValue>
			<lowerValue>248</lowerValue>
			<lowerValue>255</lowerValue>
		</classBreaks>
	</gridPlot>
</gridPlotGroup>
Log at map
Some satelite products require to be shown with a logo
<gridPlot id="Precipitation">
	<timeSeriesSet>
		<moduleInstanceId>Import_NWP</moduleInstanceId>
		<valueType>grid</valueType>
		<parameterId>P.fc</parameterId>
		<qualifierId>aladin_hr</qualifierId>
		<locationId>NWP_ALADIN_HR</locationId>
		<timeSeriesType>external forecasting</timeSeriesType>
		<timeStep unit="hour"/>
		<relativeViewPeriod unit="day" start="-5" end="10"/>
		<readWriteMode>read only</readWriteMode>
	</timeSeriesSet>
	<logo>
		<imageFile>logo.png</imageFile>
		<position>topRight</position>
	</logo>
	<classBreaksId>Precipitation_1h</classBreaksId>
	<contourLinesColor>gray</contourLinesColor>
</gridPlot>