Printing: If you want to print this document select tools -> export to pdf from the top right corner
Acknowledgements
- This Data Collection Protocol is derived from Deliverable 2.2 from the Data and Knowledge Management workpackage of the EU FP7 project Micore (revision 7).
- Improvements to this protocol have been made by the Data and Knowledge Management section of the Building with Nature programme as a Deliverable of Workpackage DM 1.1 (revision 17)
- This protocol will be used in the EU SPACE FAST: Foreshore Assessment using Space Technology.
Table of contents
Introduction
This protocol presents a guideline for data management for projects in geospatial and environmental projects. The goal of this memo is to define a data standard and archiving protocol to provide end-users with a comprehensive standardised database.
Adhering to this protocol should improve quality, reproducibility and increase the ease of use of the datasets.
Philosophy
The data protocol is based on the following principles.
The peanutbutter principle: Data collected should be treated like a peanutbutter sandwich. If the source or lineage of the data is not known the data should not be consumed without further investigation.
The lineage principle: Data is stored in its rawest format. The steps to create derived products are automated and stored in order to serve data with a known lineage.
The open data principle: Data collected or generated is open by default, closed when required. The use of open data and data standards is actively promoted and encouraged.
Premises
The following premises are taken into account.
- The collected data should be reproducible, unambiguous and self descriptive.
- The data collection procedure will be transferable
- The data collection procedure will be automated
- The data collection procedure will be based on open accepted standards
- The data collection procedure will not require non-libre software.
- The data collection procedure describes the use of public data.
- The data collection procedure can be duplicated for private data.
Data sources
Several types of are collected in projects. Most of the data collected will be geospatial or geospatial-temporal in nature. This data protocol mainly focuses on these two types of data. If required this data standard will be expanded to fit different types of research data. It is not focused on the collection of documents, literature and reports.
Common sources of data are:
- computer models
- field measurements
- experiments
- external data services
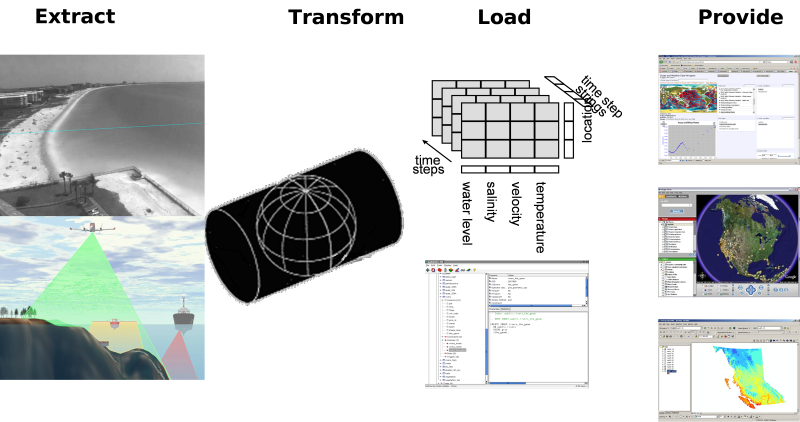
Procedure
The data collection procedure consists of four phases.
- Extract. Collecting data and storing the measured data into files.
- Transform. Enriching gathered data with metadata and storing in a standard file format.
- Load. Storing the files in a database.
- Provide. Giving access to the database.
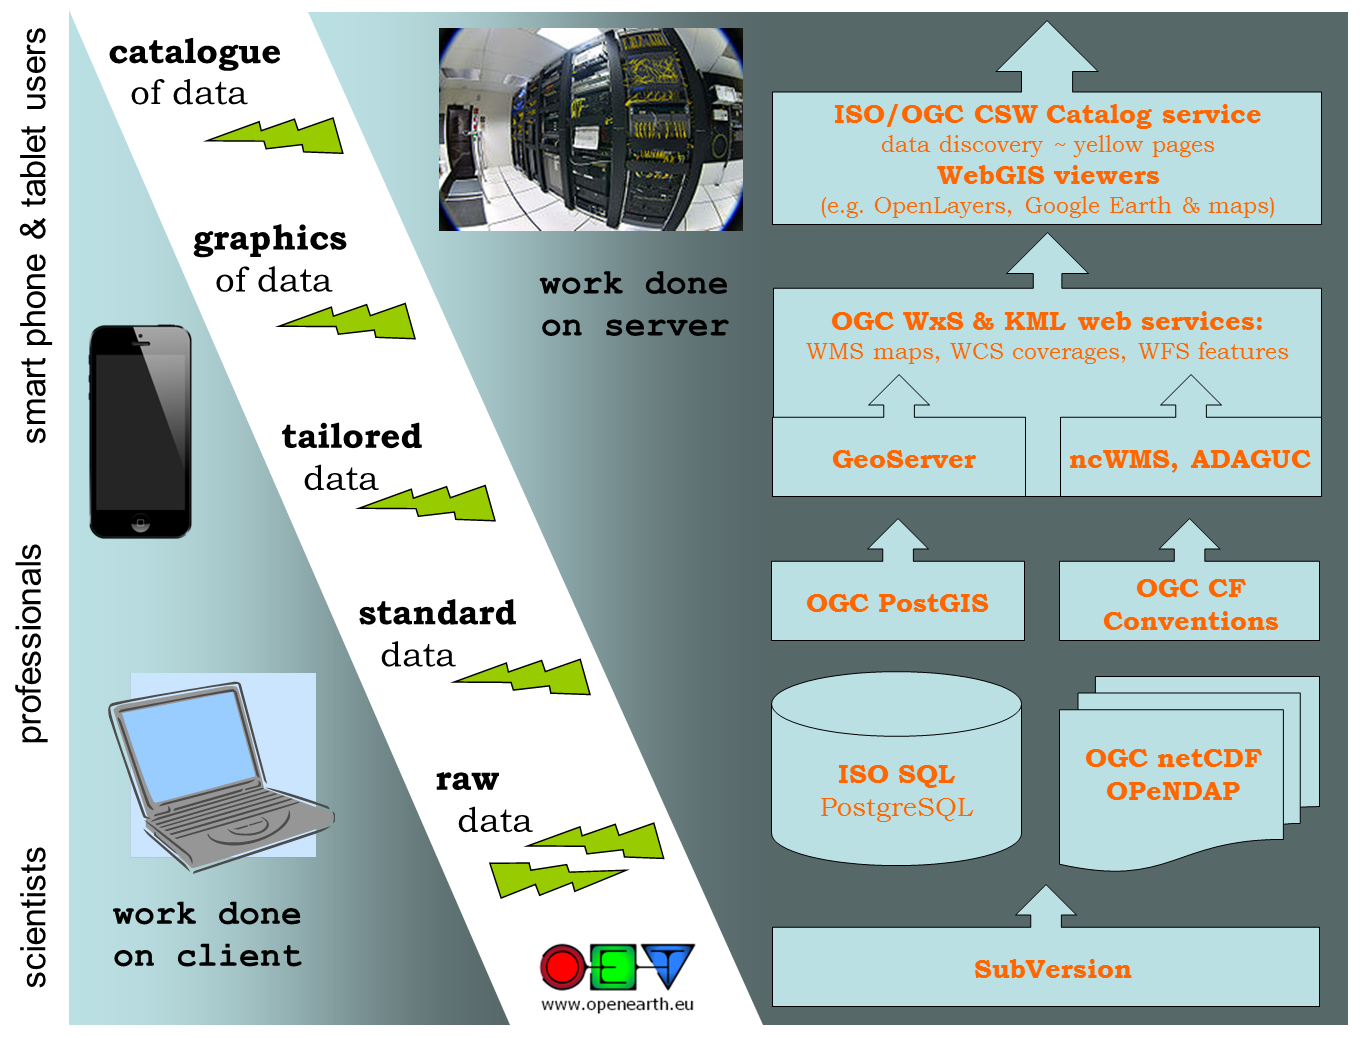
Architecture
To support the data collection procedure with software tools, the following architecture is used. This architecture uses the general client-server approach from the OGC where catalog web services link to distributed web services providing the data in WCS/WFS for grid/vector data respectively and WFS/WMS for grid/vector graphics. For graphics we also encourage KML (aka Google Earth feed) which can handle both grid and vector data. In addition to these high-level tailoring services, we propose to offer web services for plain standard data (RDBMS with geo-extension or netCDF-CF-OPeNDAP). Finally, we propose to use web services for raw data + tools as well. Here we propose a transactional protocol (meaning that users can also add data) that naturally includes version control. Allowing for sharing of non-standardized data is an important first step in the 5-star model of Tim Berners-Lee. It is often an essential step since some data require significant investment to standardize (2nd star) to open standards (3rd star).
Extraction
Gathering data
This step entails the capturing of data into a persistent storage format. At this step the main focus is to gather the data in its rawest form. This is what is sometimes called level 0 data. Often, over time, the processing of data improves, one then often wants to redo the processing starting from level 0.
Storing the raw information and all subsequent steps allows for a complete responsibility trail, giving more confidence in the data source.
For data that is gathered from data services one does not always have to copy the data. If the data is archived and fixed (storage guaranteed and not changing) one can suffice by storing the url. Note that some data archives are actually exposures of data end products, which can change if new analysis become available. This breaks the lineage chain if you did not make a copy of the data you used for analysis.
Required information
To make our data collection reproducible, unambiguous and self descriptive we have to look at the following aspects and look at the required information. The geospatial, time and physics aspects of the data is important as most data collected in this project is related to these aspects.
General metadata
General information on a data set will be filled in a metadata form(see below). The resulting metadata file contains the following information:
- title
- description
- contact information
- resource identifier (unique location where data is stored)
- other aspects like, date, lineage, language, authorization, copyright, etc...
This general information will be collected using the inspire directive
To make data understandable for others and to conform to the European Inspire guideline extra metadata should be provided. The inspire guideline follows the ISO19115 metadata standard.
For data stored in netCDF you can use the automated translation between attributes in the netCDF file and the ISO19115 standard. You can check your adherence to the ISO19115 standard using the ncISO tool.
Another way to adhere to the inspire standard is by filling in the forms in the inspire metadata editor. The resulting file should be saved next to the data set. See Inspire metadata editor for some guidance.
Geospatial
Referencing information on the earth requires the definition of a location. References done to a location are done in a coordinate system. Several types of coordinate systems exists. Most relevant are
- Geographical coordinate system. This defines the size and shape of the earth (for example World Geodetic System 1984) , the origin (usually equator and greenwich) and the units (degrees).
- Projected coordinate system. This defines a translation from the original geographic coordinate system in another (usually x,y cartesian) coordinate space. For example WGS 84/UTM zone 31N is defined as the transverse mercator projection of the WGS84 spheroid defined in meters.
- Engineering coordinate system. This is a local system often related to a local object. For example in a physical experiment or on a boat.
- Vertical coordinate system. Several reference levels can be used for vertical coordinate systems. Reference levels can be the spheroid, the geoid, the mean sea level or for example the mean low water level.
Example of vertical coordinate system

For the geospatial information the standards of the Open Geospatial Consortium are used, valid EPSG codes can be found at Spatialreference.org.
Time
If we refer to a certain date or time there can be confusion about many aspects, possibly resulting in misinterpretation of data:
- Calendar: Gregorian or other
- Leap years: every 4 years a leap year, but not every 100 years except for every 400 years.
- Time zones
- Day light saving times
For time information the Climate and Forecasting convention will be used.
Physics
The following information needs to be stored with the measurements:
- Units of measurement
- Measurement method
- Physical phenomena
For time information the Climate and Forecasting convention will be used.
Data intake
The data extraction covers the procedure from taking measurements and making this information available in digital form. The information collected should be made accessible to others by using central storage or external public sources.
Central storage of raw data
A version control system (subversion) is used to store raw data. The advantage of using version control over just a raw file system is that for every file the lineage is automatically captured (who changed what, comments, timestamps).
The subversion repository is available at https://svn.oss.deltares.nl/repos/openearthrawdata/trunk and will provide access to raw measurements.
On windows computers this server can be accessed by use of the toirtoise svn client , through the add network wizard (webdav) or through a web browser.
The following layout is used to store the datasets
\_organization
   \_your_dataset_title
     \_inspire_description.xml
     \_raw
       \_data file1
       \_data file2
     \_cache (empty)
     \_scripts
     \_processed
Step by step
For local data sets
- Collect your raw data
- Import your raw data into the OpenEarthRawData repository under https://svn.oss.deltares.nl/repos/openearthrawdata/trunk/organization/your_dataset_title/raw/. For bigger projects you can use an extra level, for example https://svn.oss.deltares.nl/repos/openearthrawdata/trunk/ecoshape/your_working_package/your_dataset_title/raw/
- Collect all the metadata. Save the metadata in https://svn.oss.deltares.nl/repos/openearthrawdata/trunk/organization/your_dataset_title/inspire_description.xml or in your script that generates a nciso compliant netCDF file.
For public data sets
- Look up the url (web address) where the public available data sets can be downloaded.
- Fill in the inspire metadata editor save the resulting file in https://svn.oss.deltares.nl/repos/openearthrawdata/trunk/organization/your_dataset_title/inspire_description.xml.
- If the dataset is not archived it may be necessary to make a local cache.
Transformation
The main goal of the transformation step is to transform the raw data (or external source) into one consistent and unambiguous collection of datasets. This is required to make the whole data collection easily accessible.
One can consider the transformation step as a funneling step. Not all data will make it through. It is an important step for the provision and reuse of data. Data that doesn't make it through the funnel can be considered lower grade and will cost more to use in projects.
Tools build on standardized data will not work and the non transformed data should be treated with more caution.
This requires adding extra information to the collected data and the use of existing standards and conventions. Most of these tasks can be accomplished using scripts and command line utilities.
Examples of transformations are:
- File format conversions
- Reprojection
- Statistical aggregation
- Standardization
Files
The raw data can consist of many different file formats. Often the raw data is only understandable to the person who gathered, collected or created information. To make the data permanently understandable extra information is needed. Part of this information is provided in the metadata (title, author, copyright). The exact meaning of the data becomes clear after the automated conversion of the files into a standardized format.
Conversion
The data which is provided will often be in another format then netcdf/cf or shapefiles. The raw data should therefor be transformed into the proper file formats. Many types of raster data can be transformed into netcdf using the gdal library or the gdal_translate command line utility. Most feature data can be translated into shapefiles using the ogr library or the ogr2ogr command line utility. Also the arcgis toolbox can be used for these tasks.
The netcdf files generated should meet the conditions of the climate and forecasting (CF) convention if possible. You can check conformity on a netcdf checker website
The script used to transform the data will be stored in https://svn.oss.deltares.nl/repos/openearthrawdata/trunk/organization/your_dataset_title/scripts. Scripts should run without any user interaction.
Additionally, one can store data in a relational (PostgreSQL) database. On the page Protocol+data+uploading (see chapter processed data format) a document can be downloaded that describes storage of data in this online database.
The data in relational databases is stored in good agreement with the data manager, because no fixed conventions are in use for most data types. These will evolve over time and sometimes differ between datasets and projects.
Geospatial
Collected data is often stored in a geographical or projected coordinate system. For common analysis the coordinate system to use is the WGS84. If data is stored in a different coordinate system it can be described unambiguous by using a "well known text" (WKT) reference. The "well known text" coordinate system allows to describe a coordinate system. It is defined by the OGC SFA specification (chapter 9). You can look up your spatial reference WKT on the website http://www.spatialreference.org.
Time
When using time or dates it should be clear which calendar, timezone, daylight savingstime, am/pm notation is used. This is defined clearly in the NetCDF/CF convention for CF files. Other file formats often do not have a strict or unambigious definition of time. This requires extra documentation.
Physics
To answer the questions what was measured and how much there needs to be a clear description of the units of measurement, measurement method and which physical phenomena are measured. The units can be described in SI units or SI derived units. The notation should be stored in a udunits compatible way in the netcdf files. The compatible units are listed on the unidata website. Tables in relational databases do not have a units attributes so this information should be part of documentation stored with the dataset or in an extra table.
The physical phenomena that are described and their measurement method can be described in the netcdf/cf files. If a variable is described in the standard names of the CF convention this should be used if not a compatible name should be chosen.
Step by step
- Collect information about your data covering the following aspects:
- geospatial
- time
- physics
- Write a script or batch file which transforms the raw data into a netcdf/cf file or a shape file.
- Check the resulting file with the CF, SI guidelines.
- Store the script in the subversion repository under https://svn.oss.deltares.nl/repos/openearthrawdata/trunk/institute/your_dataset_title/scripts
Loading
Periodically the transformation scripts will be run and the resulting netcdf and shape files will be stored in a database. The netcdf files will be loaded into the micore opendap system (multidimensional database). This system will be available on a public website. The shapefiles will be loaded into a postgis database (relational database). This postgis database will be made available to Micore project members.
The data layer can be enriched by adding a service layer (WCS, WFS) and a presentation layer (WMS) to make data easily presentable. This part will be a cooperation between workpackage 6 and 2.
Providing.
The goal of data providing is to make the data available to everybody in the project. This will be done by directly allowing access to all the layers of the data store.
Layers | Software | Communcation protocol | how to access |
|---|---|---|---|
File layer | Coverages: Netcdf, Features: shapefiles | ||
Data layer | |||
Service layer | |||
Presentation layer |
File layer
The files will be made accessible through the subversion repository which can be accessed through the subversion, http and the webdav protocol.
Service layer
Run a web map server on top of the OpenDAP system and the spatial database.
GIS data types
The Open Geospatial Consortium (OGC) specifies services to expose the geospatial related information. This terminology will be used because much of the data collected in the Micore project has a geospatial aspect. The three main services are the Feature, Map and Coverage service.
Features
A feature is a geographic object, usually composed of a geographic object (point, polygon) with a combination properties . For example a river can be seen as a complex set of lines with properties as name, depth, lenght, waterlevel, etc. The definition from the OGC:
The quantum of geographic information is the feature. A feature object (in software) corresponds to a real world or abstract entity. Attributes of (either contained in or associated to) this feature object describe measurable or describable phenomena about this entity. Unlike a data structure description, feature object instances derive their semantics and valid use or analysis from the corresponding real world entities'meaning.
Coverage
The coverage is also a feature but it does not have single value properties but the properties are multidimensional functions. Dimensions are often spacial in nature but can also relate to time or frequency. Examples of coverages are bathymetry, wind fields, lidar measurements. The OGC definition:
A coverage is a feature that associates positions within a bounded space (its domain) to feature attribute values (its range). In other words, it is both a feature and a function. Examples include a raster image, a polygon overlay or a digital elevation matrix.
Maps
While features and coverages relate to the data it does not imply any representation. When you present your geospatial data you usually render it on a map or a globe. Rendered geospatial information is what is covered by the map services. The OGC definition:
This International Standard defines a "map" to be a portrayal of geographic information as a digital image file suitable for display on a computer screen.
Examples
Feature (geometry with attribute) |
|
|---|---|
Coverage (multidimensional function with bounded space) |
|
Map (rendered features) |
|

Presentation layer
Use a rendering engine in combination with the WFS and WCS services to render images for the WMS services.
Client layer
The use of the standards described in this protocol open up the dataset a wide variety of client tools. These are described in separate tutorials and overviews.
Roles
The following roles can be assigned in the context of this data protocol.
- Data advocate, someone who promotes the use of open data, keeps contact with other data institutes for shared direction.
- Data manager, someone who is responsible for the layout of the raw data collection. Checks the adherence to the standards and conventions. Defines new rules where necessary.
- Data ambassador, someone who knows the details about a certain dataset and is responsible for the quality and publication.
- Data scientist, someone who do the data munching, transformations, analysis and visualization.
Security and copyright
Copyright
Datasets have copyright. this means that to be able to use datasets you have to obtain a license. Import aspects to check in the license are restrictions on:
- usage
- redistribution
- derived products.
If you make a derived product (curry a dataset) there is not always a clear who owns the copyright and thus can provide licenses for usage. Please consult with your legal department for details.
The private environment
For the use of non-public data groups or organizations can make a duplicate environment for private data. Instead of public available services, these services can be made available through an intranet or other private network.
Security
Some of the services require a login (uploading raw data and scripts). This is required for the lineage. Access to services is by default non-restricted, to encourage usage of the derived products.
Links
OpenGIS
Inspire directive
Climate and Forecasting Metadata Convention
Netcdf
Opendap