Accessing netCDF/OPeNDAP data with Matlab
Since Matlab R2012a native OPeNDAP support has been added to the Matlab netcdf package that exists since R2008b+. (For older Matlab releases, get snctools which is shiiped with OpenEarthTools) From OpenEarthTools run the following set-up function to add all relevant paths:
run('...\openearthtools\matlab\oetsettings.m')
- Go to an OPeNDAP server (e.g. http://opendap.deltares.nl) and pick a netCDF file by copying the contents of the Data URL box.
Define the associated url you just copied.
url_grid = 'http://opendap.deltares.nl/thredds/dodsC/opendap/rijkswaterstaat/vaklodingen/vaklodingenKB116_4544.nc'
url_time = 'http://opendap.deltares.nl/thredds/dodsC/opendap/rijkswaterstaat/waterbase/concentration_of_suspended_matter_in_water/id410-DELFZBTHVN.nc'
and select the variable you want to plot by looking at the file contents
ncdisp(url_grid)
ncdisp(url_time)
Define the data subset to get. Not until you issue the nc_varget you will actually get the data. Even if when the underlying file would be a hundreds of GB, this step can be pretty fast provided the subset you chose is not too big. Only when you make too big a selection, Matlab will take long. This will happen for instance with the 100 + years of tidal elevation dataset at station DelftZijl Buitenhaven. This selection step is the essential difference with the approach of downloading a netCDF file and then using Matlab to view that local file from your harddisk. With OPeNDAP you do not have to download an entire file before you can view it, because you can request only a specific slice, or a subset of a matrix.
G.x = ncread(url_grid,'x');
G.y = ncread(url_grid,'y');
G.z = ncread(url_grid,'z',[1 1 1],[Inf Inf 1]); % get only one timestep (here: 1st), but all x and y, note: ncread is zero based. note: matlab has different dimension order than other netCDF tools: t is last here
T.t   = ncread_cf_time(url_time,'time'); % adapt reference date of 1970 in netCDF to Matlab reference date of 0000
T.eta = ncread(url_time,'concentration_of_suspended_matter_in_water');
plot ...
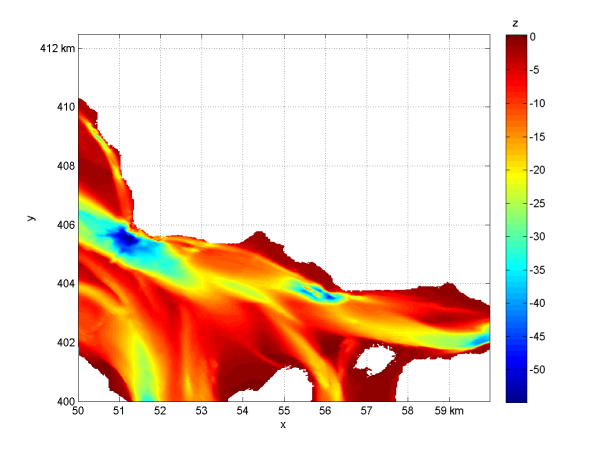
pcolorcorcen(G.x,G.y,G.z')
axis equal
axis tight
tickmap('xy')
grid on
xlabel('x')
ylabel('y')
colorbarwithtitle('z')
figure plot(T.t,T.eta) datetick('x') grid on- et voila

Download the code of this Matlab example (repos,OPeNDAP_access_with_Matlab_tutorial.m)
See also: Accessing netCDF/OPeNDAP data with python, Accessing netCDF/OPeNDAP data with R,
curvilinear model data subsetting with python