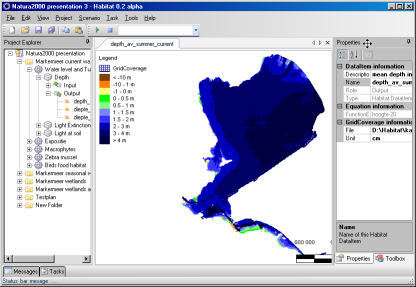
The user interface of HABITAT is presented below:
Within HABITAT we distinguish several working areas, which are highlighted in the pictures below:
|
|
|
Menu area |
Toolbar |
Project Explorer |
|
|
|
Working area response curves and maps |
Messages area |
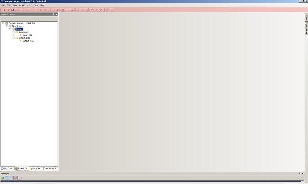


#map contents area
Click at a picture to enlarge |
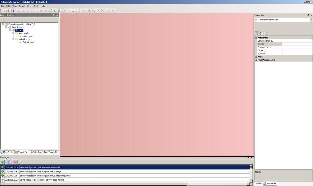
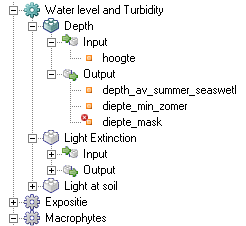
The Project Explorer shows you if maps are available (cube in front of map), if they do not exist (yet) with a cube and red cross or if they are linked with output from other models (boxed arrow before the cube). It also indicates if HABITAT is calculating and what model or scenario is being calculated. The scenario or model which is calculate is highlighted in dark blue. An example of these situations is presented below. The scenario 'Water level and Turbidity' is being calculated. Whithin this scenario HABITAT is busy with the model 'Depth'. The input map 'hoogte' and two of the result maps 'Depth_av_summer_seaswetl' and 'Diepte_min_zomer' are already there, but the third map 'Diepte mask' still needs to be produced. The other models and scenarios, presented under the highlighted scenario and model will be calculated next.
The Properties window allows you to view the names of the folders, composite models, models and maps. Extra information can be added at project and map level. Here you can enter a description as meta information. The Properties windows shows the properties of the model which is active in the tree of the Project Explorer. Please note that it is possible that a different model is active than the one shown in the working area.
In Map contents you can view maps and adjust the legend properties of the maps you are currently viewing in the working screen. You can also load new maps into the map contents window. By clicking on the ![]() symbol in the UI toolbar you can view the values of the cells in multiple layers. When you want to view several layers of maps that are inside your project you can add a new 'map' item by right clicking on the project in project explorer, select 'add' and then 'new item', choose 'Map'. Now a new 'Map' window is opened in your working screen and you can drag multiple maps in the window to compare them with
symbol in the UI toolbar you can view the values of the cells in multiple layers. When you want to view several layers of maps that are inside your project you can add a new 'map' item by right clicking on the project in project explorer, select 'add' and then 'new item', choose 'Map'. Now a new 'Map' window is opened in your working screen and you can drag multiple maps in the window to compare them with ![]() .
.
|
|
|
Add new map |
Select new Map item |
View values of multiple maps |


The map legend can also be viewed via the Map Contents window. By double clicking on the map name in the Map Contents window, you open the Layers Properties Editor. Here you can choose a legend style and change the colors, values and labels of your legend. Legends can be exported or imported by right clicking on the map in the Map Contents window and select 'Import legend' or 'Export legend'.

Layer Properties Editor
Adjust the User Interface
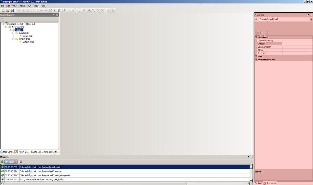
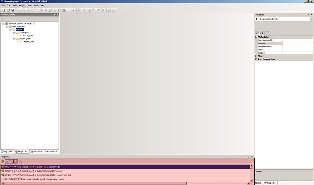
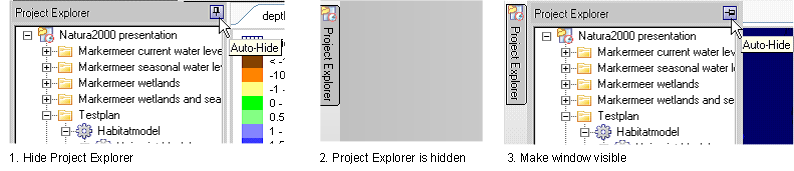
The User Interface can be adjusted by hiding and reshowing of the windows described above. This can be done by clicking at the little thumbtack at upper right corner of a window (see picture below). To undo this hiding move with your mouse to this upper right corner and ctick on the thumbtack again.
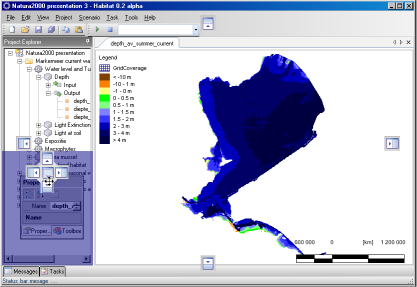
It is also possible to change the position of the windows. This can be done by dragging and dropping the windows to another place. The window will be dropped at the place which colors blue, like shown in the pictures below in four steps. In these steps the Properties and Toolbox window is moved from the left to the lower right under the Project Explorer.
|
|
|
|