You are viewing an old version of this page. View the current version.
Compare with Current
View Page History
« Previous
Version 16
Next »
DONAR MWL time series data in OpenEarth:
- Raw data + scripts (ascii + Matlab)
- All ascii time series data are available via a live web service from Rijkswaterstaat called Waterbase. The Waterbase web site has a menu to guide you to the correct data which are available via a direct access download mechanism: http://live.waterbase.nl.
- The ascii files that are returned by Waterbase need to be parsed. OpenEarthTools has a function to parse these files into a Matlab struct:
rws_waterbase_load.m. We recommend to choose the text files from Waterbase, and not the Excel files. The Excel files are not real (binary) Excel files, but are tab-delimited ascii files. This means that they do load well into Excel directly, but also that you cannot read them into Matlab with xlsread.
- The waterbase menu is in fact only a macro to construct a url that is subsequently called to download the data. Passing a command to a server via a url is a so-called web service. The web service urls to download the data can also be constructed without the macro, and be called directly from other programs, for instance by Matlab. The syntax for the waterbase urls is fairly simple. For instance, to download the water levels from Katijk in in the 18th century you can use this url. This url consists of a base-url followed by ampersand(&)-separated keywords.
http://live.waterbase.nl/wboutput.cfm?
loc=KATWK
&wbwns=1|Waterhoogte+in+cm+t.o.v.+normaal+amsterdams+peil+in+oppervlaktewater
&byear=1737&bmonth=01&bday=01
&eyear=1808&emonth=01&eday=01
&output=Tekst
&whichform=2
- In OpenEarthTools we made a toolbox that constructs the Waterbase urls for specific combinations of parameter and location. The toolbox allows you to download the data in batch mode from within Matlab. These tools have prefix
rws_waterbase_get*.m. Together with the aforementioned function to parse the ascii files (rws_waterbase_load.m), this forms a complete toolbox to work with MWTL data in Matlab.
- Standardized data (netCDF on OPeNDAP)
- Working with the bunch of text files as returned is not very useful, despite the availability of the
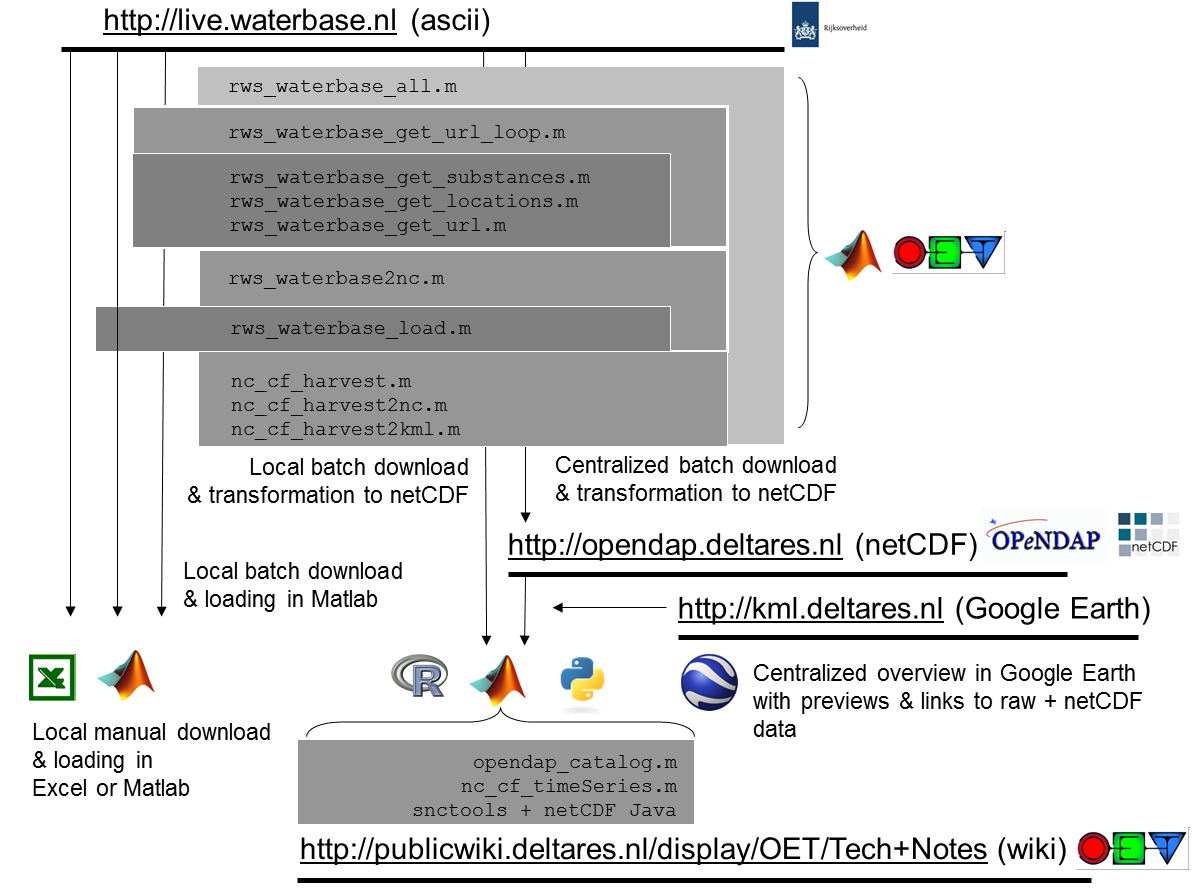
rws_waterbase*.m toolbox for Matlab. In addition, for use of the MWTL data in other analysis programs such as R and Python the rws_waterbase*.m toolbox is of no use. For both analysis languages, dedicated parse functions have to be programmed as well. Therefore, we extended the rws_waterbase*.m toolbox, so that it not only downloads the data in batch mode, but transforms the data to an internationally standardized format that can readily be used by R and python as well in addition to Matlab: netCDF-CF. This resulted in a complete workflow in Matlab that downloads Waterbase data automatically using the above mentioned web service urls, parses them into Matlab memory with rws_waterbase_load.m, and uses rws_waterbase2nc.m to save them as a netCDF-CF file , and adding preliminary Aquo meta-data. These netCDF files are made available on our open OPeNDAP server opendap.deltares.nl. We update this OpeNDAP server manually periodically. For easy querying, we harvest all meta-data, and cache that as a separate netCDF file called catalog.nc. We are planning to cache the meta-data also as a catalog.xml file, that can readily be ingested by meta-data servers such as geonetwork. As a final step we make an overview of all stations for one parameter in a kml file, aka known as Google Earth file. The Matlab script rws_waterbase_all.m performs this entire workflow. It is run periodically to update our OPeNDAP server and kml server (see Figure below).
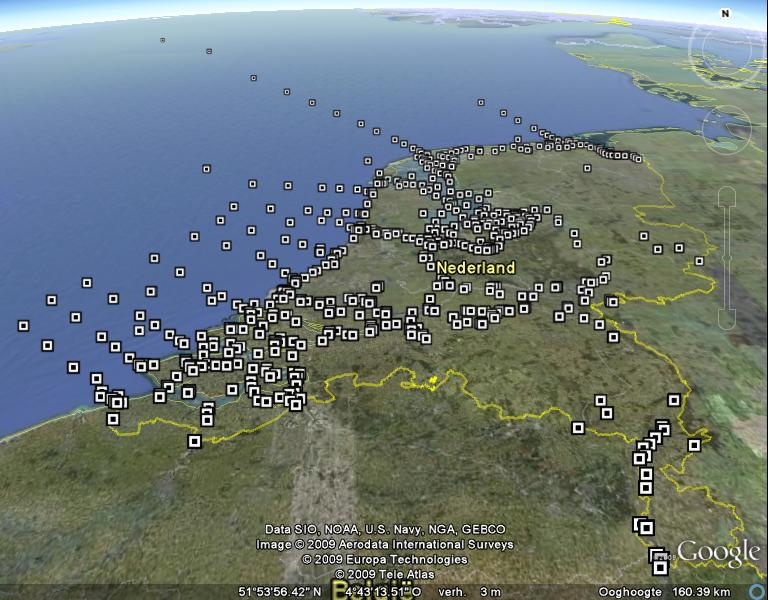
- Visualized data overviews with previews of statistics (kml):
Our kml server contains kml files with an overview of all locations per parameter. The Google Earth time slider is used to show when data is present at a specific location. For each location a pop-up shows some statistics, and a preview of the time series and histogram. The kml contains links to the netCDF data, and to the original live.waterbase.nl web service url.
DONAR MWTL time series (waterbase) description:
See also: