The Value Properties Entry Display can be used to edit or enter value properties. In Delft-FEWS, Value Properties are metadata elements associated with scalar time series data. They allow users to attach additional information to individual time step values, which can be used for analysis or reporting. Value Properties are key-value pairs that can be attached to time series data. They can represent various types of metadata, such as:
- Forecast issue time
- Severity levels
- Phase indicators (e.g., NEW, UPDATE, FINAL)
- Priority flags
These properties are stored alongside the time series data and can be read, written, and transformed by different modules in FEWS. Value Properties were introduced in Delft-FEWS when CAP messages were imported and exported. In the Delft-FEWS database, each value in a scalar time series can have the following database fields: Date-Time, Value, Value source, Validation flag and flag source, Custom flag source columns, User and Comment. For the meta data that is for example stored in CAP messages we introduced Value Properties.
- An unlimited number of value properties can be added to value
- The size of one value property can be 65.000 characters
- Do use this functionality efficiently, do not add complete documents to a value property!
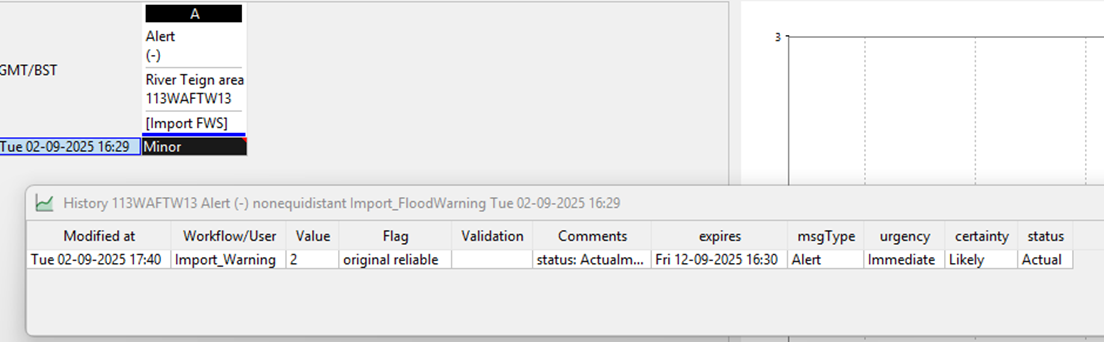
The most easy way to display the value properties is in the Time Series Display by using the CTRL+H (History) function when a value in the data table is selected.
Some Value Properties can also be used in Transformations (statistics). For example: count all values where the Value Property “Phase” is equal to “NEW”
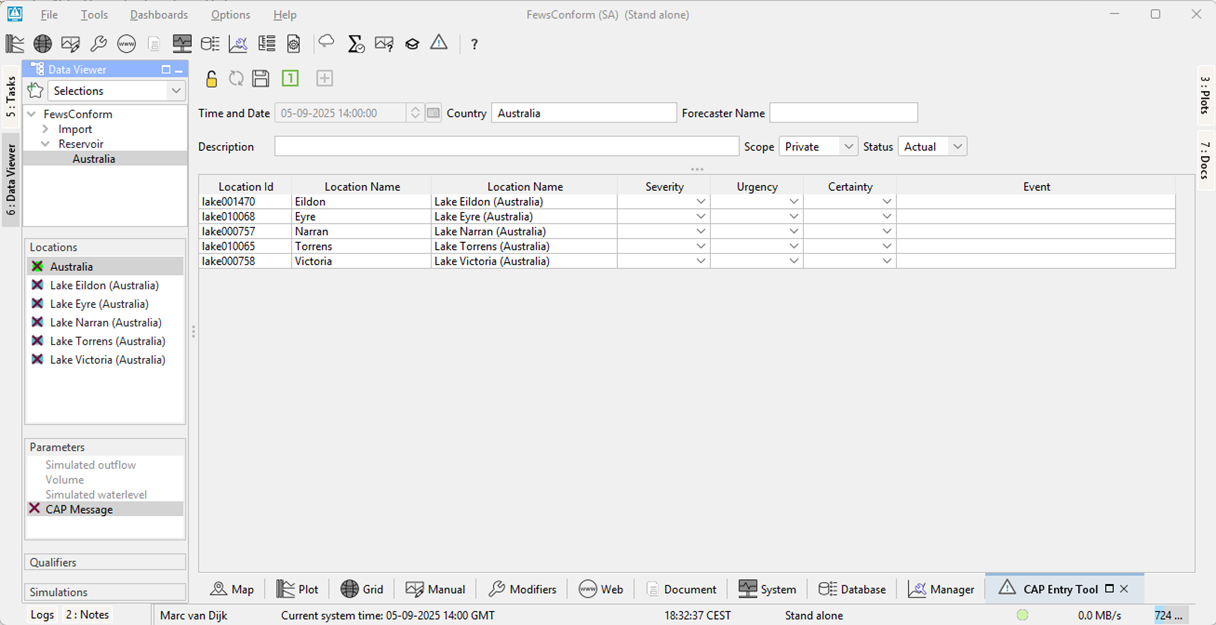
To show the functionality of the Value Properties Entry Display, a simple example will be used. This example shows a list of 'sub' locations (reservoirs) linked to the 'master' location Australia.
To create a new Value Properties display you need to have two configuration files edited or added:
- A Display configureation file: \DisplayConfigFiles\CapDisplay.xml
- The display configuration file added to the Explorer.xml file
   	<explorerTask name="CAP Entry Tool">
		<iconFile>IconWarning.svg</iconFile>
		<displayConfigFileName>CapDisplay</displayConfigFileName>
		<toolbarTask>true</toolbarTask>
		<menubarTask>true</menubarTask>
		<allowMultipleInstances>false</allowMultipleInstances>
		<loadAtStartup>true</loadAtStartup>
	</explorerTask>
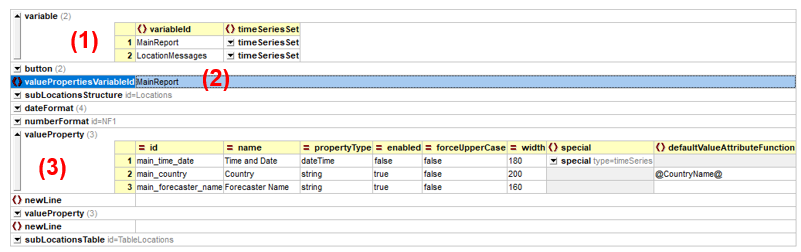
The example display has 3 groups of elements:
- A button bar
- Entry fields for the master location
- Entry table for the sub locations
Button bar
The first 3 buttons are ‘free’, no configuration required
- Lock; to lock the display. The selection on the ‘master’ location does not change when switching selected locations in the Data Viewer or Tasks display
- Refresh; to refresh the information in the display. When observed or forecast time series are included in the display, the values of the series can be updated in the database by external processes (imports, edits). The Value Property Entry display is not automatically updating these values. Press the Refresh button to check for updated values.
- Save; to save entered Value Properties.
Additional buttons can be added in the config (type)
- Initial : empty entered value properties fields in the display
- Update: enable edit mode of existing value properties
- Correct: correct existing value properties
- ReportDraft: create a report without saving the data
- ReportFinal: save the data and create a report
- RunWorkflow: run a configured workflow
The configuration of the buttons have a minimum of 3 attributes: a name, icon and type.
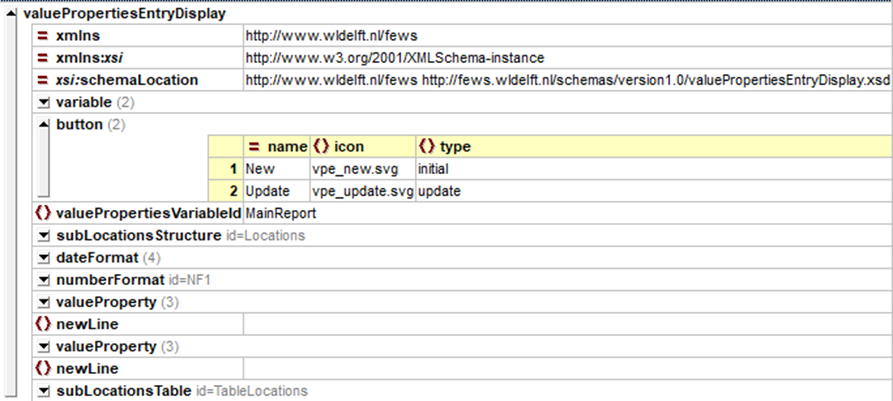
Master Location Elements
The ‘Master‘ location is the location that is selected in the Data Viewer or Topology: ‘Australia’
- The ‘Master’ location must be included list of variables (timeSeriesSets) (1)
- The element ‘valuePropertiesVariableId’ contains the variableID of the master location (2)
- Multiple elements are added for all fields on the display (3)
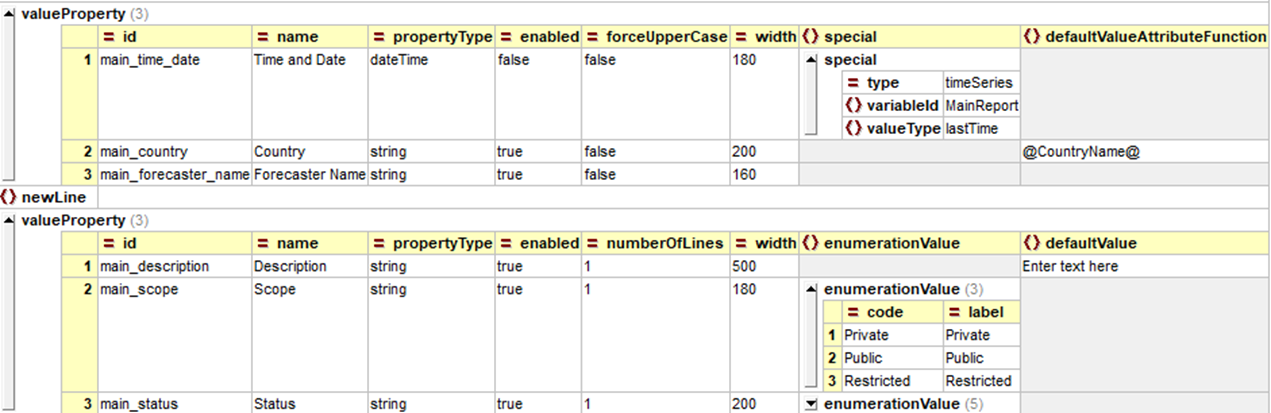
The example display contains several value property entry fields.

The elements can be of different types
- Newline element to start a new row in the display
- Value Property element with an editable field to enter data. A Value Property field can be filled with information from a special element like time series, location attribute, default value or enumeration value
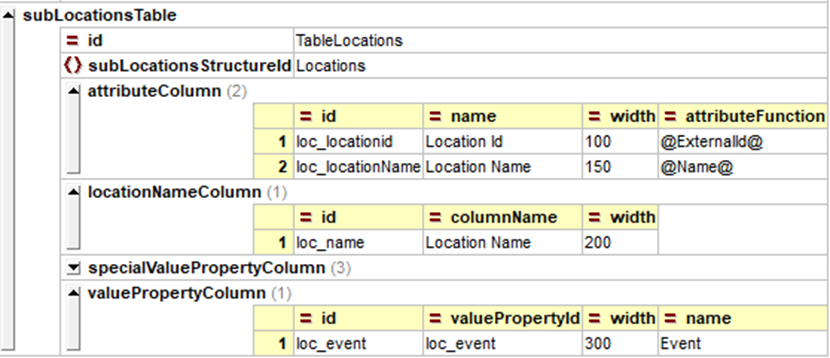
Sub Location Table
One or multiple sub location tables can be added to the display. The connections between the master location and the sub locations is configured in the <subLocationsStructures> element. This is done to keep the data structure information separate from the user interface which keeps the code and configuration cleaner and this way the <subLocationStructure> configuration can be reused in the report export valuePropertiesTags without needing the user interface configuration.
The sublocations that will be added to the table are selected based on a matching sublocation attribute Id. Both the Master location and the sub locations require a matching location attribute, the linking is therefore not resolved with related locations.
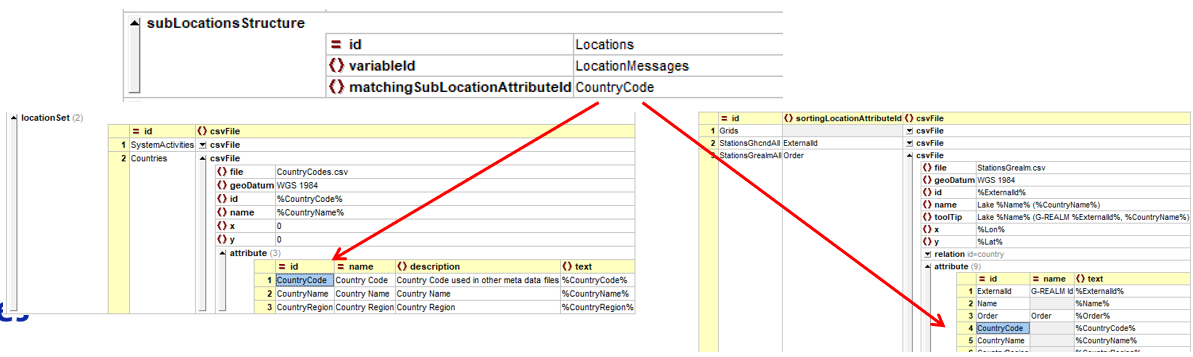
The sub-locations are included in a subLocationsTable where each table has a unique Id. Each table is linked to a sublocationsStructure and each table can have one or multiple rows with information. The information is shown in the columns of the table:
- Attribute Columns, linked to location attributes
- Location Name column
- Value Property Column
- Special Value Property Column, for enumerations
- Time Series Column, linked to time series in database
- Value Column, for storing time series for the selected location
- Order Attribute Column
Each of these sub location table columns has its own attributes. Important are the Id, name and width attributes. More information on the column attributes can be found in hte XML schema.