Testing new functionalities in Delft3D4 and Delft3D-FM
In this research, we have attempted to adapt and test some new formulations and functionalities related to sediment transport modelling in Delft3D and Delft3D-FM (D-FM). These functionalities are usually not used in morphological modelling of rivers and reservoirs. Following approaches and functionalities are considered for this research that could be relevant for improving sediment dynamics in rivers and reservoirs (also considering impact of reservoir operation on river ecology and habitat suitability):
1) A new transport formula for fine sediment: Kitamura formula was developed based on flume experiment and applied in some reservoirs in Japan (Kitamura, 1995). The new entrainment function proposed by Kitamura is based on bed shear stress in a comparable way as the entrainment function of the Partheniades and Krone (PK) formula that is traditionally used in Delft3D models for mud. In Kitamura formula, the critical shear stress is not defined by the user (as in the PK) but computed from the porosity of the bed. Also, the fine sediment diameter can be assigned in Kitamura formula unlike in PK. The spatial and temporal variation in porosity and thus variation in the critical shear stress could be relevant for modelling fine sediment erosion and deposition processes triggered by reservoir operation, e.g. deposition and erosion of fine sediment in gravel bed rivers leading to change in porosity and erodibility (affecting the river ecology and habitat).
2) Variable porosity: Since Kitamura formula allows variable porosity, we have attempted to test various approaches of computing spatial and temporal variability of porosity. This could be relevant for simulating dynamics of fine sediment over coarser river bed due to reservoir flushing and hydropeaking. However, not all formulations are useful also given the fact that fine sediment does not explicitly affect the changes in gradation, thus porosity in Delft3D. This will be considered in our ongoing research work.
3) Fluff layer: A sediment layer, which is in the water column during high velocity, forms a fluff layer during low flow velocity (see Figure 1). This could be relevant for the case of reservoir sedimentation and erosion processes (usually short-term), since under certain condition there could be formation of a fluff layer in the reservoir that erodes quickly during sluicing or flushing. However, first tests show that the functionality is not yet fully applicable to the reservoir processes and requires further research (in progress).
4) Consolidation of fine sediment: The deposition and consolidation of fine sediment is relevant for large reservoirs (longer-term deposition and consolidation process in the reservoir) as well as for rivers affected by dam operation (quick consolidation e.g. during hydropeaking, sluicing and flushing leading to wet and dry conditions at the downstream river reach and affecting river ecology and habitat). However, for present research, the testing was carried out only to see how the porosity variation is computed with this module. The test shows that this functionality (in combination with other processes, mentioned above) requires further research and assessment on its applicability to correctly replicate (short-term) fine sediment dynamics in rivers and reservoirs (in progress).

Figure 1 Definition of the fluff layer between water column and bed layer, with entrainment and deposition terms (Groenenboom, 2015)
Testing the behaviour of fine sediment (mud) transport formulae
A sensitivity test has been performed to explore the behaviour of Kitamura and PK formulae of mud transport and their effect on bed morphology. Some analyses are shown in Omer et al. (2020) and Giri et al. (2020) as a part of this project.
Model description
A simple 500 m wide and 5000 m long rectangular channel with a flat and constant bed level (= -5 m) is considered for the test simulation. The model set-up is depicted in Figure 2. The model has only a mud layer (2 m initial thickness) in the bed. The particle size (valid for Kitamura formula) is 0.011 mm. A constant velocity (= 0.6 m/s) at upstream and water level (= 0 m) at downstream are imposed as boundary conditions.

Figure 2 Model grid used for testing
Result
The result of bed level changes for simulations with both formulae is depicted in Figure 3. As we can see. The bed level change is sensitive to some model parameters. It also shows that the behaviour of Kitamura and PK formula appears to be similar for certain selected parameters.

Figure 4 Sensitivity of the parameters in Kitamura and PK formulae to bed levels
Testing the porosity functionalities
Description
There are various approaches for porosity computations, implemented in Delft3D. We made a review and testing of these functionalities to assess their applicability for rivers and reservoirs. Here are outlines of the approaches that are considered:
1) Constant porosity (user defined constant value), specified in Kitamura formula of mud transport – applicable to this study.
2) Porosity variation based on sediment gradation (proposed by R. Frings, 2011) - applicable only for sand-gravel mixture and not mud or fine sediment, since they are not considered in sediment gradation.
3) Porosity variation based on a consolidation model; calculated at every time step by the model based on a simplification of Gibson’s consolidation equation as proposed by Winterwerp et al. (2018) – Not always applicable for river cases. For the river reach affected by reservoir operation, sand-mud interaction including faster consolidation is important factor.
4) User-defined spatially varying porosity field (not updated during the simulation)
Result
We have used the same model for testing as shown above. At this stage, we have only considered user-defined porosity (constant and spatially variable). The effect of porosity variation on bed morphology and critical shear stress is depicted in Figure 4, Figure 5 and Figure 6. The model behaviour showing sedimentation in the area with low porosity, which can be attributed to the higher critical shear velocity (as per Kitamura’s formula), which results in lower transport rate than the surrounding area. However, the magnitude of sedimentation is not fully related to only critical shear velocity, but also bed shear stress, which also appears to be affected by this variation. We need to explore this in more detail in our ongoing work (in progress).

Figure 4 Bed level at the end of the simulation using Kitamura formula with a constant porosity (= 0.64, upper plot) and locally variable porosity (see bottom plot with an area having porosity = 0.44)
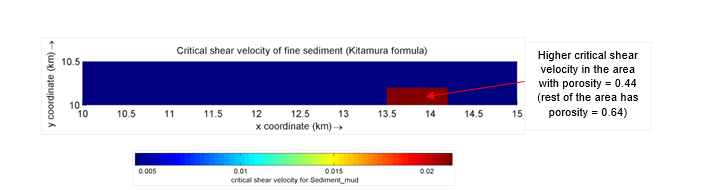
Figure 5 Variation of critical shear velocity for the case of variable porosity (as per Kitamura formulation)

Figure 6 Bed level profile along the longitudinal section through sediment deposition (shown in Figure 5) for different computational cases
Testing fluff-layer functionality
Description
The fluff layer is a thin layer that is used to simulate the dynamical layer between the bed and the water column. It does not contribute to the bed or water depth and only consist of mud particles (van Kessel et al., 2012). In case of relatively high bed shear stresses, e.g. during flood velocities, fine sediments are stirred up and become suspended. In conditions with low flows these particles will settle again. This timescale is much smaller than for the bed layer below. To capture this physical behaviour of the fine particles, the fluff layer is treated different than the bed layers and has its own critical shear stress and erosion parameters.
A short review has been made about the application of fluff layer in Delft3D. Here are some outlines about the approach and limitations:
- A sediment layer which is in the water column during high velocity forms a fluff layer during low flow velocity. This process takes some time as such there is a phase lag between the reduction of velocity and formation of fluff-layer.
- The fluff-layer is a fast-responding layer to changes in flow conditions (much more erodible compared to the bed layer), so almost no contribution to bed level
- The properties of the fluff layer are different from the layers in the bed. For example, the critical shear stress is much smaller.
- The concept of fluff-layers is mostly applied for coastal and estuarine areas, as this is the area where beds with a lot of mud can be found.
The entrainment and deposition processes in the fluff layer are computed in a similar way as the regular mud processes according to the concepts of Krone and Partheniades. Herein, we tested the application of a fluff-layer in a simple model. and in a few simulations for Funagira model. The objective of the tests is to qualitatively assess the outcomes compared to the reference case (without the fluff layer).
Parameters related to fluff layer are as follows:
1) Critical shear stress for erosion of the fluff layer into the water column
2) Maximum erosion flux from the fluff layer
3) Erosion parameter for the fluff layer (for erosion from fluff layer into water column)
4) Deposition factor; can be a constant or spatially varying (between 0 and 1, where 0 indicate no deposition and values higher than 0 (up to 1) means that a fraction of the fluff layer is deposited to increase the bed level)
Result
We used the default parameter settings and only varied the constant deposition factor (DepFac). It is to be noted that the bed is eroded in all cases, although the parameter DepFac seems to behave as expected. The functionality must be tested in graded sediment (multilayer) model as well. More thorough testing and analysis are necessary to assess its applicability for reservoir morphology. The research is in progress.
Concluding remark
The research is in preliminary stage due to its fundamental nature. The testing, real-world application as well as implementation in Delft3D-FM are still in progress. The adaptability and application of the functionalities for the case of rivers with dams and reservoirs shall be explored in detail given the fact that most of these approaches are still in research and development phase.
References
Frings et al. (2011). Verification of porosity predictors for fluvial sand‐gravel deposits. Water Resources Research, 47, W07525, doi:10.1029/2010WR009690.
Groenenboom, J. (2015.) Modelling sand-mud-bed interaction in the Scheldt estuary. MSc thesis Delft University of Technology, August 2015.
Giri et al. (2020). Hydraulics and environmental modelling application for large scale river system – I. Morphological and habitat modelling downstream of Funagira Dam (Subproject B1 & B2). Final report. 11204511-000-ZWS-0001, March 2020.
Kitamura, Y. (1995). Erosion and transport processes of cohesive sediment in dam reservoirs. Journal of Hydroscience and Hydraulic Engineering. 13-1, 47-61.
Omer et al. (2020). Environmental effects variation of sediment flushing and sluicing. Optimization of reservoir operation and management (Project A). Final report. 11204511-000-ZWS-0002, March 2020.
Van Kessel et al. (2012). Bed module for sand-mud mixtures in framework of BwN project NTW 1.3 mud dynamics. Deltares report 1200327-000.
Winterwerp et al. (2018). Efficient Consolidation Model for Morphodynamic Simulations in Low-SPM Environments. J. Hydraul. Eng., 2018, 144(8): 04018055.