This element is used to configure the background maps to be displayed. The more advanced options are described below. Rather straightforward options like northArrowVisible are self explaining.
Contents:
description
Optional description of the configuration. Used for reference purposes only.
Zoom Extents
The extents defined will appear in a drop down list in the toolbar above the map. Selecting an extent will change the view window of the map to the specified location.
Each extent contains the following attributes:
- name: name of the zoom extent (displayed in the drop-down list)
left, right, top, bottom: Coordinates of the zoom extent. Note that in displaying the maps for the extent defined, the map display will be scaled to fit the extent in the current display window.
geoDatum
Configuration of a geoDatum is important for the display of map layers in the FEWs Explorer and Grid display. A geoDatum is the coordinate system the extents, or map layers are defined in. Enumeration of of geoDatums of many different coordinate systems are available in Appendix B.
projection
One can use various projections: mercator, web_mercator, orthographic, llxy and gnomonic. In combination with WMS services only (web-) mercator is possible.
defaultExtent
Definition of the default zoom extent.
extraExtent
Definition of the additional zoom extents. Multiple entries may exist.
Example
An example configuration containing two extents is shown below.
<geoDatum>WGS 1984</geoDatum>
<defaultExtent id="my_defaultZoom" name="Default">
	<left>96.38403320312536</left>
	<right>112.68774414062536</right>
	<top>1.8519463253148256</top>
	<bottom>-5.9482950514716</bottom>
</defaultExtent>
<extraExtent id="Indonesia" name="Indonesia">
	<left>92</left>
	<right>141</right>
	<top>7</top>
	<bottom>-11</bottom>
</extraExtent>
Connections
For downloading layers from servers, sever different types of connections can be established.
wfsConnection

Notice that you need to specify a mapLayersCacheDir in the global.properties, like mapLayersCacheDir=%REGION_HOME%/MapCache
More info on connection to ArcSDE and WFS can be found here.
wmsConnection
Defines a Web Map Service (WMS) connection that can be referenced by a wmsLayer.
arcSdeConnection
ArcSDE protocol is no longer supported in the map background layers. ESRI GeoServer supports the WFS protocol besides the ARCSDE protocol. The WFS protocol can still be used
Layer Choices
Many different types of layers can be defined to be included in the map. All configured layers will be shown in the layer selection panel, where they can be turned on/off by the user. Some of these layers will be explained below.
coverageTileArchiveLayer
Since 2013.01 FEWS enables using a compressed grid file for your DEM. The compression is done per scale and in tiles and archived in a zip file, pretty similar as openStreetMap works.
You can prepare a CTA (coverage tile archive) with the F12 menu in the explorer (F12 -> convert -> convert ascii grid to coverage tile archive).
As the resulting file should be in meters (see below why) you may need to specify a conversion factor from eg. centimeter to meter. You can also define an accuracy of the compressed values. Normally centimeter accuracy is more than enough, sometimes you can easily go to decimeters, which compresses much better of course. For synchronization reasons you may want to split the resulting file in parts of e.g. max 2 GB. Usually this is more than enough. The resulting compression is generally a factor of about 10-20. But the main reason is the much better performance of the GUI as per pixel is already determined which value should be plotted.
A very useful additional feature (to be used in the griddisplay only) is the feature that you can use the CTA as a real DEM and use it for plotting of water depths.
You then can easily display the water depths per pixel, based on a time series with water levels (using global datum!) and the DEM in the CTA. Therefore, enable the property useAsLocalDatumReference. Note, usesDatum in Parameters.xml for the respective parameterGroup should be set "true". The waterlevels can have any spatial distribution, like grid or polygon and should not have the exact same grid definition as the DEM. The calculation of the depths is completely on the fly and no depths have to be stored in the database.
<coverageTileArchiveLayer id="asc">
  <file>petten.cta</file>
  <visible>false</visible>
  <useAsLocalDatumReference>false</useAsLocalDatumReference>
  <classBreaks>
    <lowerColor>brown</lowerColor>
    <upperColor>green</upperColor>
    <lowerValue>-4</lowerValue>
    lowerValue>-1</lowerValue>
  </classBreaks>
</coverageTileArchiveLayer>
<gridPlot id="Petten">
  <timeSeriesSet>
    <moduleInstanceId>Floodmap</moduleInstanceId>
    <valueType>grid</valueType>
    <parameterId>H.sim.hist</parameterId>
    <locationId>Floodmap_grid</locationId>
    <timeSeriesType>simulated historical</timeSeriesType>
    <timeStep unit="minute" multiplier="1"/>
    <readWriteMode>read only</readWriteMode>
  </timeSeriesSet>
  <classBreaks>
    <break lowerValue="0" color="light blue" opaquenessPercentage="25"/>
    <break lowerValue="1" color="blue" opaquenessPercentage="75"/>
    <break lowerValue="2" color="purple" opaquenessPercentage="75"/>
  </classBreaks>
  <geoMap>
    <geoDatum>Rijks Driehoekstelsel</geoDatum>
    <projection>mercator</projection>
    <defaultExtent id="Petten testmodel">
      <left>-1000</left>
      <right>10000</right>
      <top>4000</top>
      <bottom>0</bottom>
    </defaultExtent>
    <extraExtent id="Nederland">
      <left>-200000</left>
      <right>500000</right>
      <top>750000</top>
      <bottom>200000</bottom>
    </extraExtent>
    <scaleBarVisible>true</scaleBarVisible>
    <northArrowVisible>true</northArrowVisible>
    <labelsVisible>true</labelsVisible>
    <backgroundColor>light blue1</backgroundColor>
    <openStreetMapLayer id="osm" name="Open Street Map">
      <url>http://tile.openstreetmap.org</url>
      <cacheDir>$MAP_CACHE$/openstreetmaps</cacheDir>
    </openStreetMapLayer>
    <coverageTileArchiveLayer id="asc">
      <file>petten.cta</file>
      <visible>false</visible>
      <useAsLocalDatumReference>true</useAsLocalDatumReference>
      <classBreaks>
        <lowerColor>brown</lowerColor>
        <upperColor>green</upperColor>
        <lowerValue>-4</lowerValue>
        <lowerValue>-1</lowerValue>
      </classBreaks>
    </coverageTileArchiveLayer>
  </geoMap>
</gridPlot>
esriShapeLayer
With this layer a background shape file can be defined. This layer supports the common shape layer elements.
Other elements that can be used include:
- id : Id of the background map
- description : optional name of the backgroundmap
- file: path to the shape file
An example of the various options, that can be completely mixed is shown in the below picture.
geoJSonLayer
From version 2022.01 you can use a geoJSON files instead of shape files. When the geoJSON file contains multiple shape types you can use the same geoJSON file in multple layers with different types (options: point, line, polygon)
<geoJsonLayer id="geojson">
  <file>provinces.geojson</file>
  <shapeType>polygon</shapeType>
  <visible>false</visible>
  <lineColor>black</lineColor>
  <fillColor>light yellow</fillColor>
</geoJsonLayer>
openStreetMapLayer
To make use of a server that uses the open street map protocol.
From version 2018.02 it has a standard copyright label in the right bottom corner. It needs no extra configuration and can't be turned off.
<openStreetMapLayer id="Osm">
<url>http://tile.openstreetmap.yourserver.com</url>
<cacheDir>$REGION_HOME$/OsmTiles</cacheDir>
</openStreetMapLayer>
For testing purposes you can use "http://tile.openstreetmap.org"
wmsLayer
To make use of a WMS server you have to use the option for wmsLayer.
You can request the capabilities of a WMS server by entering a url in your browser. The url you need to enter to do so is the base url of the server (anything before the '?' character) with "?request=GetCapabilities&service=WMS" added to it. For example, if your WMS server can be found at www.mywmsserver.com, the url you need to enter to request its capabilities is: www.mywmsserver.com?request=GetCapabilities&service=WMS
Some additional explanation for a few of the elements that can be configured for a <wmsLayer>:
- <url> : Base url for the wms server. This is everything before the text "VERSION=" in the url. Use & to include a &
- <geoDatum> : Since 2023.01. EPSG:3857 (Web Mercator) / or by default EPSG:4326 (WGS 84). When the WMS server supports Web Mercator it is recommended to configure EPSG:3857. This is more accurate than the default EPSG:4326 (WGS84) when zoomed out and far from the equator.
- <wmsVersion> : Since 2018.02. Version of the wms server. Between different versions, the formatting of the url to get the wms layer may differ. FEWS currently supports version 1.1.1 (used by default and used in versions older than 2018.02) and version 1.3.0. To find the versions a WMS server supports, you can request its capabilities as described above.
- <wmsLayerName> : Layer name to display. It's the part after the text "LAYERS=" till the next & or ; in the url. To find the layer names a WMS server has, you can request its capabilities as described above.
- <vendorParameter> : Any parameters you need FEWS to pass in the url in each request it sends to the WMS server. For example, if you wish to configure a wms layer and your WMS server supports several "Styles", you can ensure that FEWS requests the correct style by adding a vendorParameter element with name="Styles" and value="the value you want". To find the styles supported by a WMS server, you can request its capabilities as described above.
- <imageFormat> : jpg, png, gif. Default is jpg
- <transparent> : Only supported for png
and gif
Note that the wmsLayers configured in the geoMap will be used as a background layer and will not be animated over time. If you wish to show a wms layer that contains time series data, you should configure a <gridPlot> which contains a <wmsLayer> element for the layer instead. More information on configuring animated wms layers can be found on the Grid Display configuration page.
<wmsLayer id="meteosat"> <url>http://geoservices.knmi.nl/cgi-bin/METEOSAT9_DEMO.cgi?&SERVICE=WMS&</url> <geoDatum>EPSG:3857</geoDatum> <wmsLayerName>IR108</wmsLayerName> <cacheDir>$REGION_HOME$/wms_meteosat_cache</cacheDir> </wmsLayer>
<wmsLayer id="srtm" name="SRTM Elevations">
    <url>http://geoserver.webservice-energy.org/geoserver/mapserv/ows?</url>
    <geoDatum>EPSG:3857</geoDatum>
    <wmsLayerName>srtm</wmsLayerName>
    <visible>false</visible>
    <cacheDir>$CACHE_FOLDER$/WMSLayers/srtm</cacheDir>
</wmsLayer>
<wmsLayer id="ahn2">
<url>http://geodata.nationaalgeoregister.nl/ahn2/wms?service=wms&request=getcapabilities</url>
<geoDatum>EPSG:3857</geoDatum>
<wmsLayerName>ahn2_5m</wmsLayerName>
<cacheDir>$REGION_HOME$/ahn2_5m</cacheDir>
</wmsLayer>
serverShapeLayer
To make use of a Wfs or ArcSDE connection you have to use the option for serverShapeLayer. This layer supports the common shape layer elements.

layer
Definition of a GIS layer to be displayed.
Attributes;
- id : required id of the map layer- must be unique for the current geoMap element.
- name : optional name of the map layer defined
Elements:
description : Optional description of the map layer. Used for reference purposes only.
className : Name of the class used in displaying the map layer. A different class is required for different types of GIS data. NOTE: Defining a class name allows advanced users to add additional display functionality to the OpenMap utility, and this being used in map displays in DELFT-FEWS. See the OpenMap documentation for details on how to add additional display classes.
visible : Boolean flag indicating if layer is visible by default.
properties : Definition of properties associated with the map layer to be displayed. Properties that need to be defined depend on the class used. At least one property must be defined. This may be a dummy property. Multiple entries may exist.
Some additional information on the elements that can be defined in properties:
- string : Definition of a string property. An example is the definition of the geoDatum for displaying shape files using the geoDatumDisplay class.
- key : Key to identify the property
Value : Value of the property defined.
Note: when displaying a shape file layer that does not use WGS 1984 as the coordinate system, a property must be defined that defines the geo datum. To do this set the key value as "geoDatum" and define the coordinate system using the enumeration in Appendix B.
See some examples of nice tile layers below. See also http://server.arcgisonline.com/ArcGIS/rest/services/
<layer id="World" name="ArcGIS World_Topo_Map">
  <className>nl.wldelft.libx.openmap.GenericTileServerLayer</className>
  <properties>
    <string key="tileUrlPattern" value="http://server.arcgisonline.com/ArcGIS/rest/services/World_Topo_Map/MapServer/tile/%ZOOM%/%ROW%/%COLUMN%"/>
    <string key="cacheDir" value="%REGION_HOME%/mapcache/Esri_topo"/>
    <int key="minZoomLevel" value="1"/>
    <int key="maxZoomLevel" value="19"/>
    <int key="topZoomLevel" value="21"/>
    <int key="tileSize" value="256"/>
  </properties>
</layer>

<layer id="Canvas" name="ArcGIS Canvas World_Light_Gray_Base">
  <className>nl.wldelft.libx.openmap.GenericTileServerLayer</className>
  <properties>
    <string key="tileUrlPattern" value="http://server.arcgisonline.com/arcgis/rest/services/Canvas/World_Light_Gray_Base/MapServer/tile/%ZOOM%/%ROW%/%COLUMN%"/>
    <string key="cacheDir" value="%REGION_HOME%/mapcache/Esri_Canvas_World_Light_Gray_Base"/>
    <int key="minZoomLevel" value="1"/>
    <int key="maxZoomLevel" value="19"/>
    <int key="topZoomLevel" value="21"/>
    <int key="tileSize" value="256"/>
  </properties>
</layer>

<openStreetMapLayer id="Osm" name="Open Street Map">
  <url>http://tile.openstreetmap.org</url>
  <cacheDir>$REGION_HOME$/OsmTiles</cacheDir>
</openStreetMapLayer>

<openStreetMapLayer id="Osm" name="Open Street Map (Toner)">
  <url>http://tile.stamen.com/toner</url>
  <cacheDir>$REGION_HOME$/mapcache/stamen_toner</cacheDir>
</openStreetMapLayer>
Common Shape Layer Elements
These elements are supported for both the serverShapeLayer and the esriShapeLayer:
- visible: Controls if the layer is automatically visible. When false the user has to switch on the layer manually. By default the layer becomes automatically visible.
- usedBySelectByMapItemTool: Controls if the layer is used by the "Select by map item tool" in the FEWS explorer to easily select all locations in a polygon.
selectByMapItemLocationRelation: When this element is specified an location relation is used to find locations at the map instead of the polygon border.
selectByMapItemAttributeEquals: When this element is specified a (multivalued) location attribute is used to find locations at the map instead of the polygon border.
- label: Label that is displayed at the map. Labels are decluttered so not all labels will be visibile when zooming out. Note that by default the <labelsVisible> element of the <geoMap> is set to false. If you wish to display labels with the locations in a shape layer, you must set <labelsVisible> to true.
- tooltip : information that is displayed when the user is moving the mouse cursor over a shape. To see this information turn on the 'Information' button.
- lineColor : color of the line
- fillColor : color of the area
- opaquenessPercentage: percentage of opaqueness.
- lineWidth : width of the line
- pointSize or pointIconId: allow size adjustment of points in a shape-layer, resp. displays an icon (as defined in LocationIcons.xml) at the points in the shape-layer (Notice: add filename extension!)
- classBreaksAttributeName : name of a shape attribute (dbase column name) which is to be used to determine the class breaks.
- classBreaks : used to define class breaks for the shape-layer. The fill color can depend on the value of a shape attribute. When the shape attribute is of type text, e.g. country name, add a class break for every country with a label that equals the country name. For the lower values use 1, 2, 3, ... etc
An example for color classification based on attributes is shown below. Notice that all possible values need to be included.
<esriShapeLayer id="WS Indonesia">
                <file>ws_indonesia</file>
                <geoDatum>WGS 1984</geoDatum>
                <visible>true</visible>
                <toolTip>%WS%</toolTip>
                <lineColor>gray</lineColor>
                <classBreaksAttributeName>Balai</classBreaksAttributeName>
                <classBreaks>
                    <break lowerValue="0" label="BWS Sulawesi II" color="aquamarine1"/>
                    <break lowerValue="1" label="BWS Papua" color="purple2"/>
                    <break lowerValue="2" label="BWS Maluku" color="red1"/>
                </classBreaks>
            </esriShapeLayer>
Since 2017.02 several label formatting elements are supported:
- labelFontSize: controls the font size used in the labels.
- labelBackgroundColor: color of the label background, will be white by default.
- labelOpaqueness: opaqueness percentage of the label background, will be 50 by default.
- labelBorderColor: color of the border drawn around labels. When no border color is defined, no border will be drawn.
- labelAtLine: boolean (true by default) that controls whether labels for line shape-layers are drawn on the lines and will move along the line when the view window is adjusted. When false, the labels for lines are placed next to the line and the location is fixed (as was done for versions before 2017.02). Note that this boolean should only be used in combination with a line shape-layer. Also note that labelAtLine can not be used in combination with the labelXAttribute and labelYAttribute elements.
- labelXAttribute and labelYAttribute: name of a shape attribute (dbase column name) which is to be used as the x and y-coordinate of the label respectively. When these attributes are given, the coordinates in the given columns will be used for label placement, overruling all other placement options. Note that if the specified columns are left empty for some shapes, these shapes will be assumed to have no label, thus no label will be displayed. Note that these elements can't be used in combination with the labelAtLine element.
An example for a label configuration is shown below.
<esriShapeLayer id="myPrettyLabelLayer">
	<file>layerFile</file>
	<label>%labelColumn%</label>
	<labelFontSize>15</labelFontSize>
	<labelFontColor>blue</labelFontColor>
	<labelBackgroundColor>red</labelBackgroundColor>
	<labelOpaqueness>20</labelOpaqueness>
	<labelBorderColor>black</labelBorderColor>
	<labelXAttribute>labelXColumn</labelXAttribute>
	<labelYAttribute>labelYColumn</labelYAttribute>
	<lineColor>gray90</lineColor>
	<fillColor>yellow</fillColor>
	<opaquenessPercentage>25</opaquenessPercentage>
</esriShapeLayer>
Since 2017.02 for shape-layers containing points, class breaks are allowed to use icons instead of colors. If both class breaks containing icons and a pointIconId is specified, the pointIconId is used as a default when no class break applies. It is also used in the image displayed before the layer name in the layer selection panel. Note that this image will only be loaded if the layer has been loaded, i.e., was ever visible during the current session. A config example is shown below.
<esriShapeLayer id="myPointLayer" name="Some Points">
	<file>myPointLayer.shp</file>
	<pointIconId>default_icon.gif</pointIconId>
	<classBreaksAttributeName>ICON_ATTRIBUTE</classBreaksAttributeName>
	<classBreaks>
		<break lowerValue="0" label="low" icon="green_circle.gif"/>
		<break lowerValue="1000" label="high" icon="blue_square.gif"/>
	</classBreaks>
</esriShapeLayer>
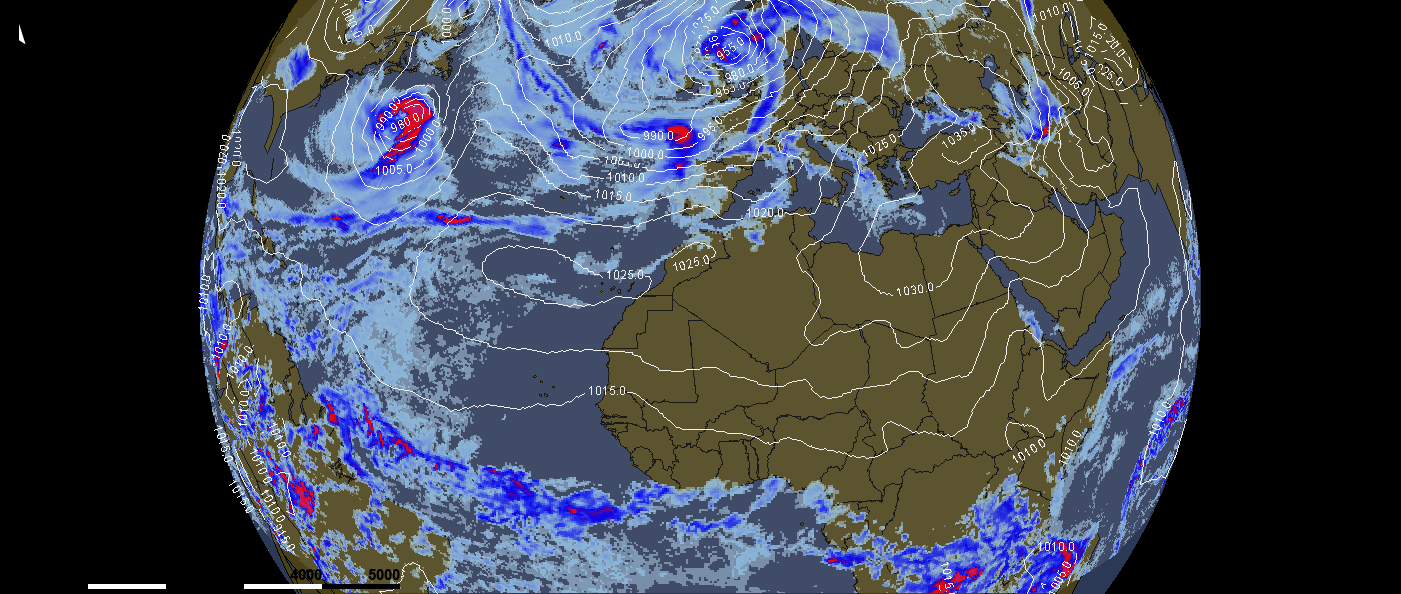
<geoMap>
    <geoDatum>WGS 1984</geoDatum>
    <projection>orthographic</projection>
    <defaultExtent id="NW halfrond">
        <left>-90</left>
        <right>5</right>
        <top>90</top>
        <bottom>0</bottom>
    </defaultExtent>
    <extraExtent id="Europa">
        <left>-2</left>
        <right>25</right>
        <top>75</top>
        <bottom>30</bottom>
    </extraExtent>
    <extraExtent id="Nederland">
        <left>2</left>
        <right>6</right>
        <top>54</top>
        <bottom>50</bottom>
    </extraExtent>
    <scaleBarVisible>true</scaleBarVisible>
    <northArrowVisible>true</northArrowVisible>
    <labelsVisible>true</labelsVisible>
    <backgroundColor>dark slate blue</backgroundColor>
    <esriShapeLayer id="World">
        <file>cntry98</file>
        <geoDatum>WGS 1984</geoDatum>
        <visible>true</visible>
        <lineColor>black</lineColor>
        <fillColor>dark olive green</fillColor>
    </esriShapeLayer>
    <gridLayer/>
    <esriShapeLayer id="World (overlay)">
        <file>cntry98</file>
        <geoDatum>WGS 1984</geoDatum>
        <visible>true</visible>
        <lineColor>black</lineColor>
        <opaquenessPercentage>0</opaquenessPercentage>
    </esriShapeLayer>
</geoMap>
The above config example of using a orthographic projection will result in the below picture. In this picture the GFS precipitation forecast is combined with isolines of airpressure.