in progress
Printing: If you want to print this document select tools -> export to pdf from the top right corner
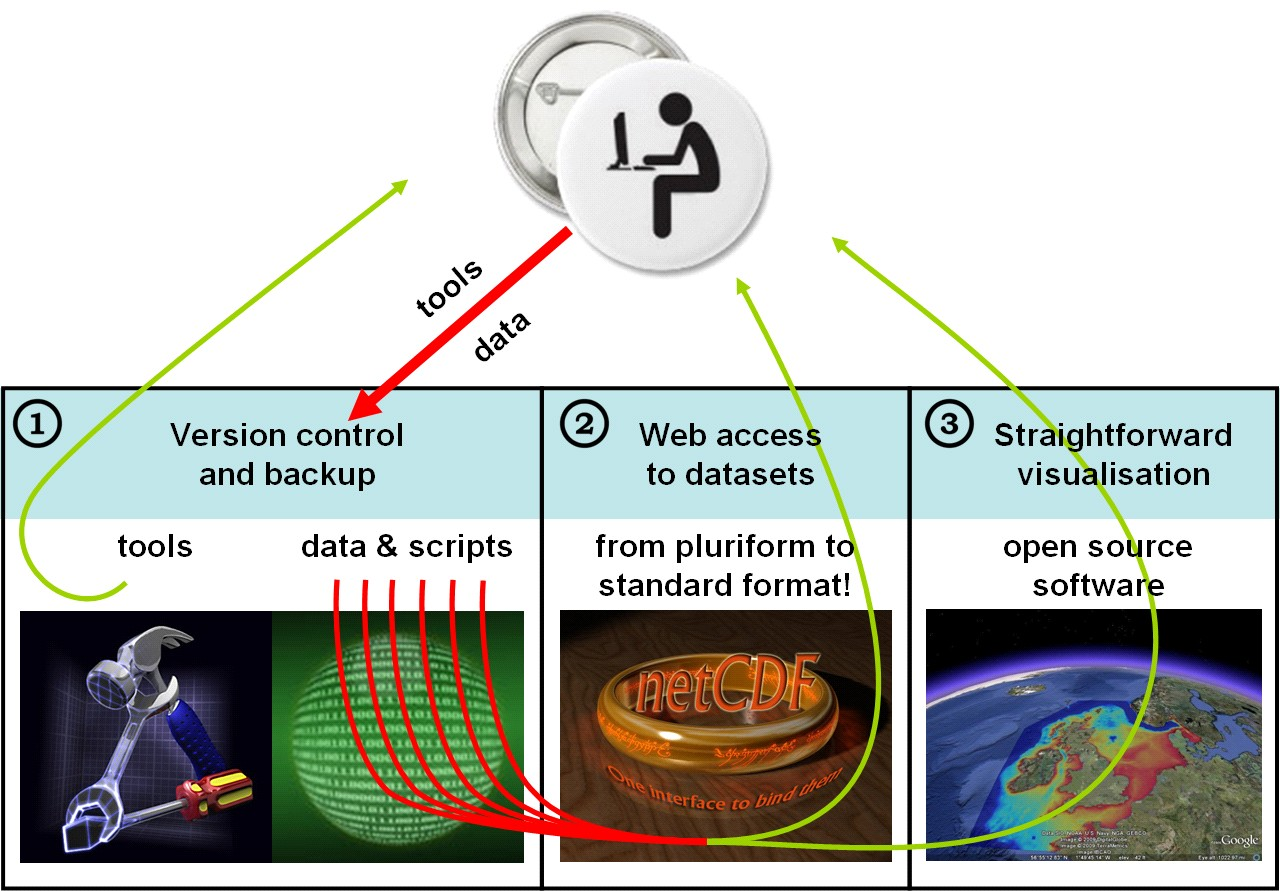
In this manual we describe how to use data from an OpenEarth system that consists of a Subverison repository, an OPeNDAP server and a server with Google Earth feeds.
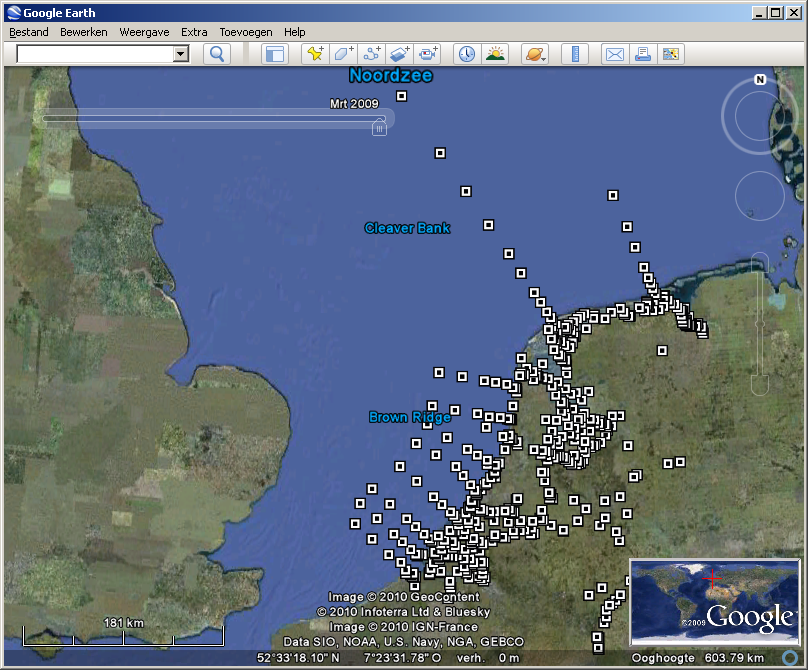
- Get the Google Earth file with the overview of the data from the http://dtvirt5.deltares.nl/kml/, e.g.:
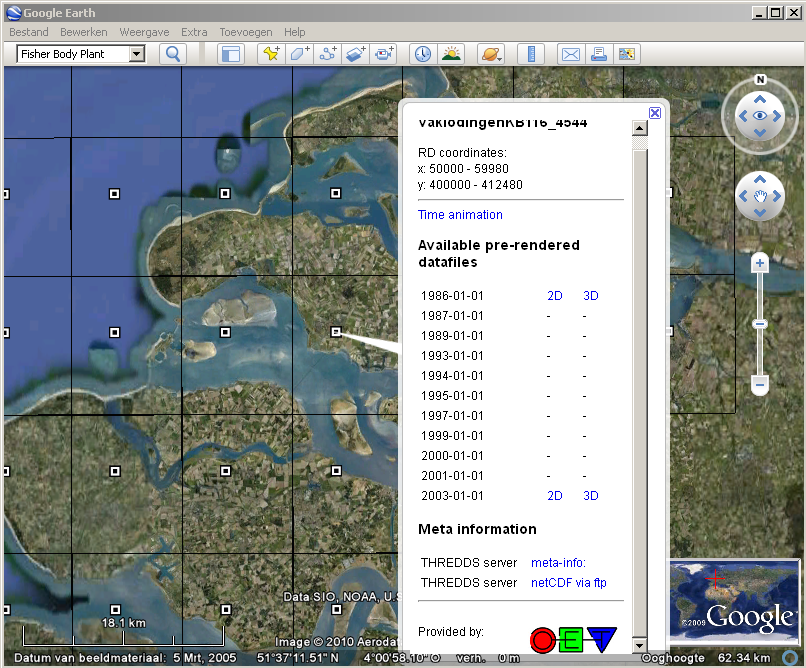
- Click on the placemark of the map or time serie you want to analyse, and then select the link THREDDS meta-info. Note: for the time series remember to drag the time ruler such that all times are available: drag the whole ruler first to the most recent data and then drag the left part of the ruler to the oldest date.

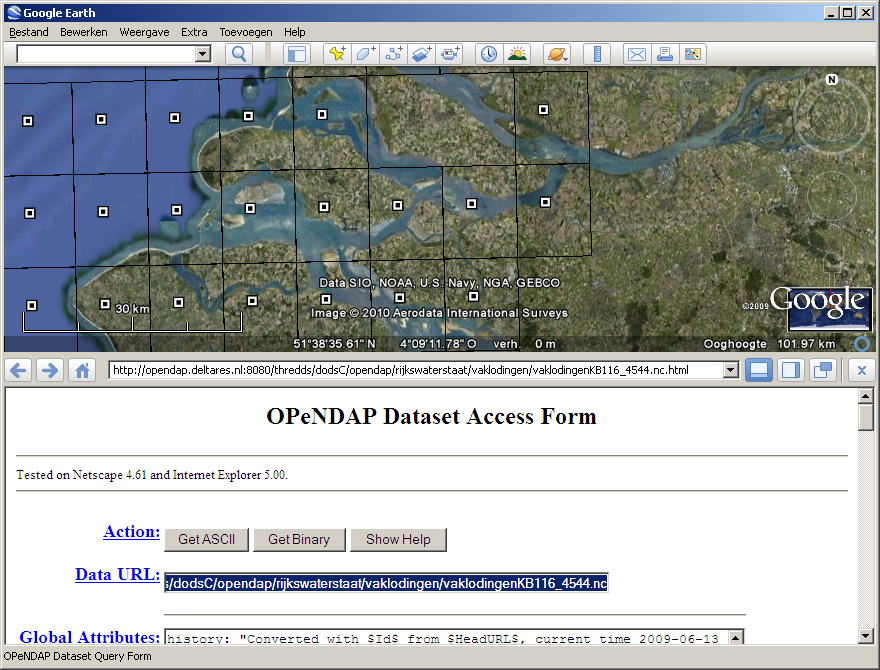
- In your browser the OPeNDAP meta-info page of the dataset will pop-up.

- Select all the in the box labeled Data URL.

- Paste this URL in a client viewer that can read OPeNDAP data.
- e.g. ncBrowse:
- select menu file > OPeNDAP
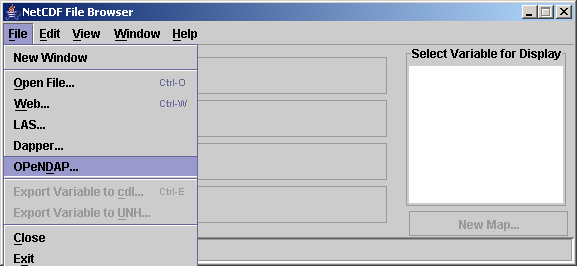

- paste the url you just copied.
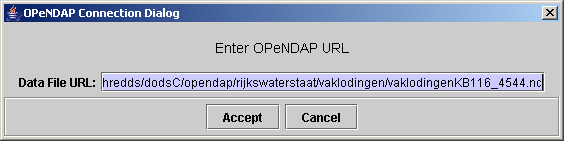

- double-click the variable you want to plot, e.g. z
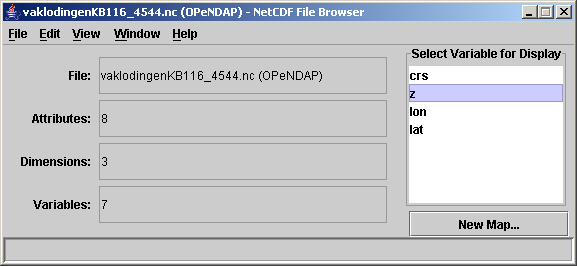

- set the x dimension as x-axis, and y the y-dimension as y-axis.


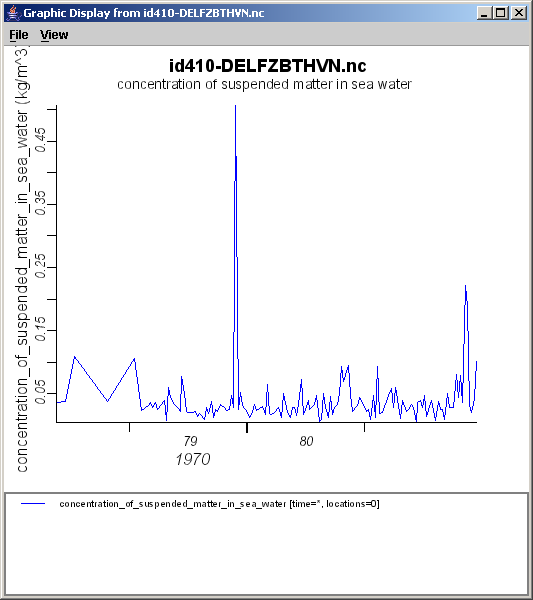
- et voila

- select menu file > OPeNDAP
- e.g. Delft3D-Quickplot
- e.g. Matlab
- e.g. ncBrowse: