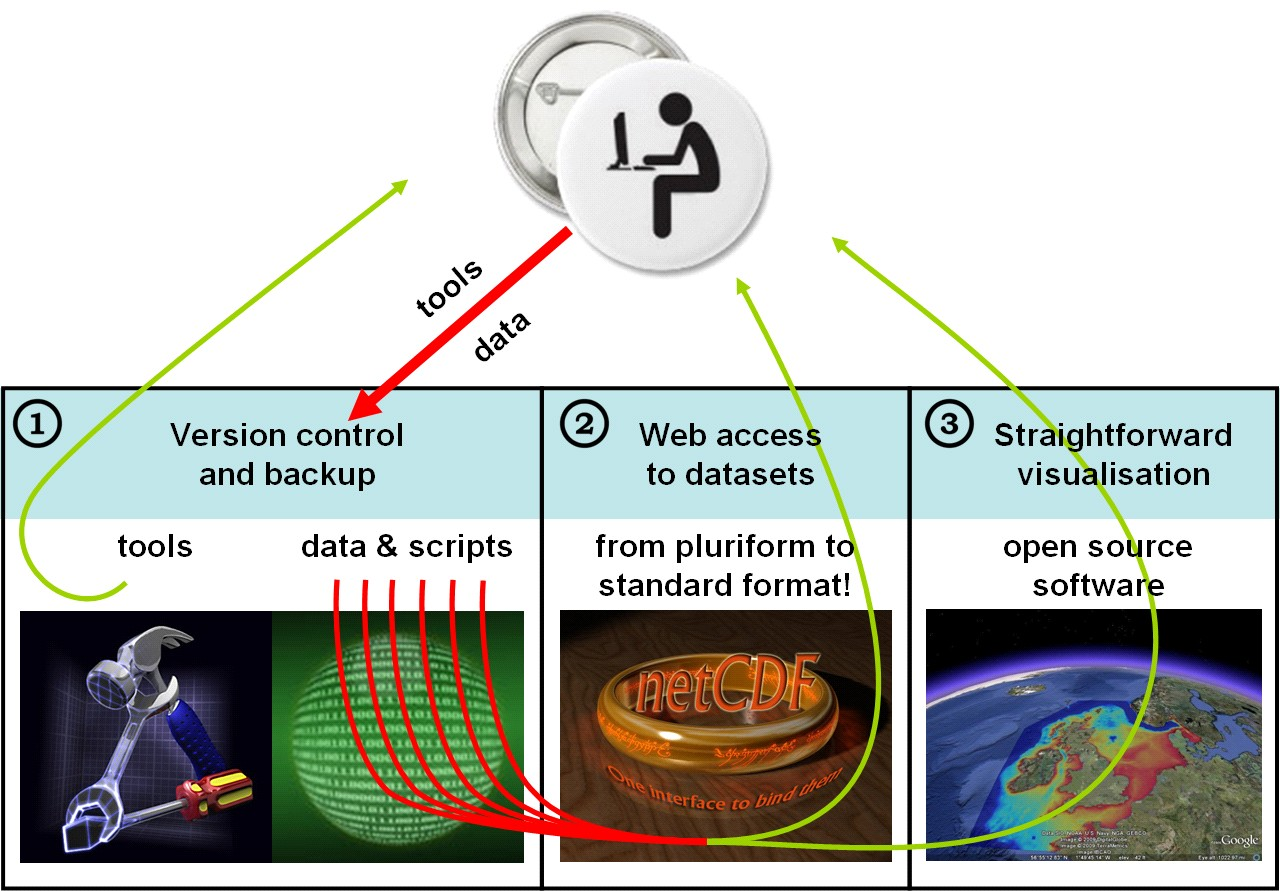
In this manual we describe how to use data from an OpenEarth system that consists of a Subverison repository, an OPeNDAP server and a server with Google Earth feeds.
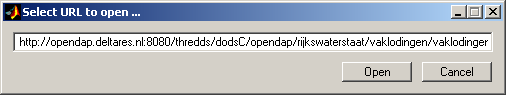
- Get the Google Earth file with the overview of the data from the kml server, e.g.:
- Maps
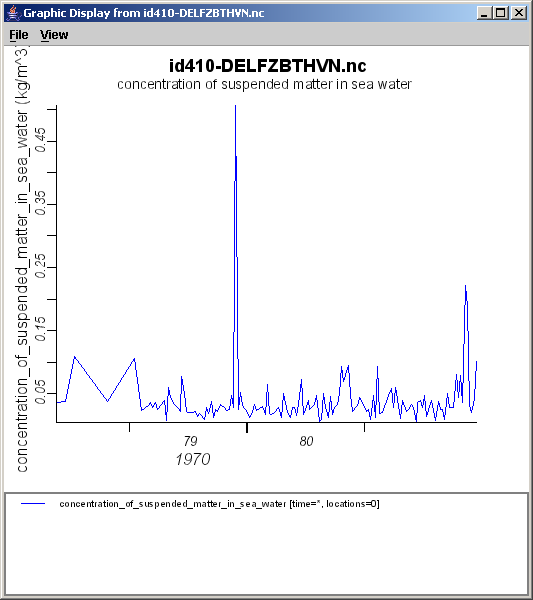
- Time series
- Rijkswaterstaat Waterbase (water levels, wave period/direction, water temperature, salinity, chlorofyll, suspended sediment)
- KNMI wind
- KNMI daily averaged meteo (wind, air temperature, sunshine, radiation, precipitation, air pressure, visibility, cloud cover, relative humidity, potential evapotransipration)
- Click on the placemark of the map or time serie you want to analyse, and then select the link THREDDS meta-info. Note: for the time series remember to drag the time ruler such that all times are available: drag the whole ruler first to the most recent data and then drag the left part of the ruler to the oldest date.


- In your browser the OPeNDAP meta-info page of the dataset will pop-up.


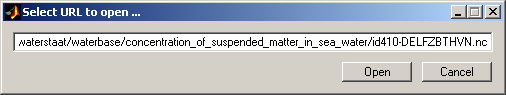
- Select all the in the box labeled Data URL.


- Paste this URL in a client viewer that can read OPeNDAP data, e.g. ncBrowse, Matlab, arcGis, Delft3D.
- e.g. arcGis 9.2+ with free EDC extension.
- e.g. ncBrowse:
- select menu file > OPeNDAP
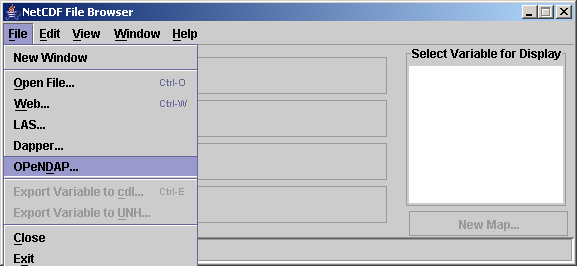
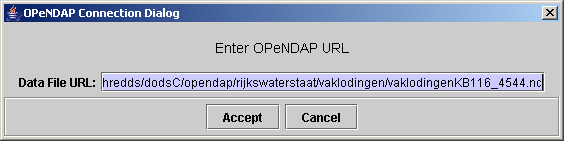
and paste the url you just copied. The viewer will now download the meta-information from the OPeNDAP server. Even if when the underlying file would be a hundreds of GB, this step is always very fast.

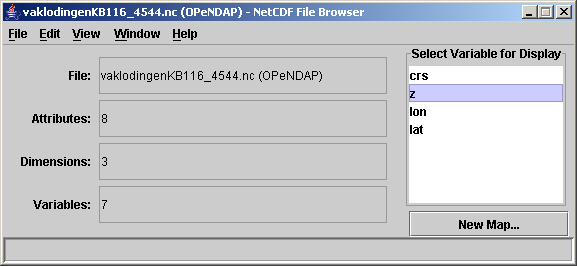
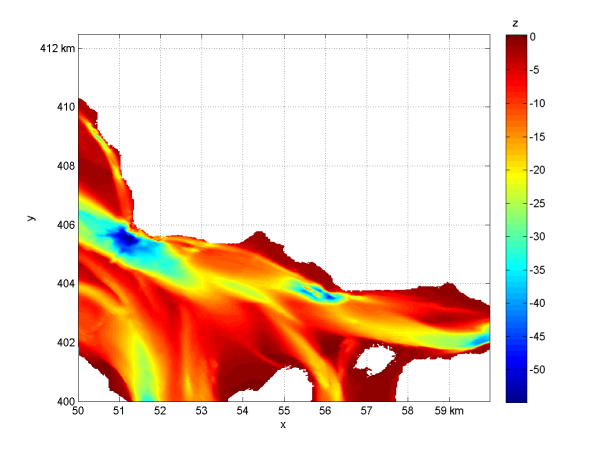
- select (double-click) the variable you want to plot, e.g. z.

- Define the data subset to get. Set the x dimension as x-axis, and y the y-dimension as y-axis. Not until you press graph variable the viewer will actually get the data. Even if when the underlying file would be a hundreds of GB, this step can be pretty fast provided the subset you chose is not too big. Only when you make too big a selection, ncBrowse will ill-behave. This will happen for instance with the 100 + years of tidal elevation dataset at station DelftZijl Buitenhaven. This selection step is the essential difference with the approach of downloading a netCDF file and then using ncBrowse to view that local file from your harddisk. With OPeNDAP you do not have to download an entire file before you can view it, because you can request only a specific slice, or a subset of a matrix.


- et voila (epxlore do the excellent zoom functionality of ncbrowse, especially the time-axis)

- select menu file > OPeNDAP
- e.g. Matlab with OpenEarthTools extension.
- the url you just copied.
url_grid = 'http://opendap.deltares.nl/thredds/dodsC/opendap/rijkswaterstaat/vaklodingen/vaklodingenKB116_4544.nc'
url_time = 'http://opendap.deltares.nl/thredds/dodsC/opendap/rijkswaterstaat/waterbase/sea_surface_height/id1-DELFZL.nc'
- select the variable you want to plot by looking at the file contents
nc_dump(url_grid)
nc_dump(url_time)
- Define the data subset to get. Not until you issue the nc_varget you will actually get the data. Even if when the underlying file would be a hundreds of GB, this step can be pretty fast provided the subset you chose is not too big. Only when you make too big a selection, Matlab will take long. This will happen for instance with the 100 + years of tidal elevation dataset at station DelftZijl Buitenhaven. This selection step is the essential difference with the approach of downloading a netCDF file and then using Matlab to view that local file from your harddisk. With OPeNDAP you do not have to download an entire file before you can view it, because you can request only a specific slice, or a subset of a matrix.
G.x = nc_varget(url_grid,'x');
G.y = nc_varget(url_grid,'y');
G.z = nc_varget(url_grid,'z',[0 0 0],[1 625 500]);% get only one timestep, but all x and y, note: nc_varget is zero based.
pcolorcorcen(G.x,G.y,squeeze(G.z(1,:,:)))
tickmap('xy')
grid on
xlabel('x')
ylabel('y')
colorbarwithtitle('z')
T.t = nc_cf_time(url_time,'time'); % adapt reference date of 1970 in netCDF to Matlab reference date of 0000 T.eta = nc_varget (url_time,'sea_surface_height'); plot(T.t,T.eta) datetick('x') grid on - et voila

- the url you just copied.
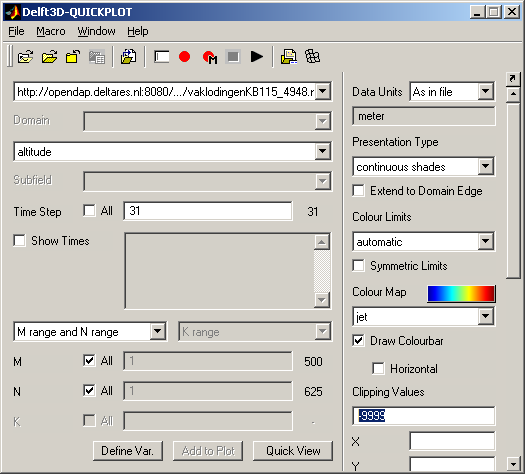
- e.g. Delft3D-Quickplot (release 3.29.x)
- select menu file > url and paste the url you just copied. Delft3D-Quikcplot will now download the meta-information from the OPeNDAP server. Even if when the underlying file would be a hundreds of GB, this step is always very fast.

- Select the variable you want to plot by looking at the file contents
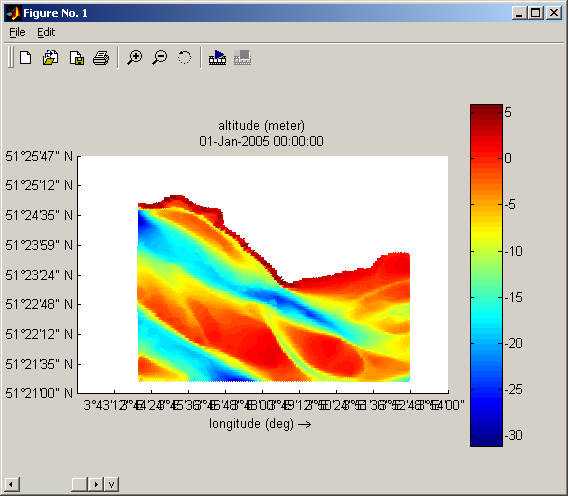
- Define the data subset to get.

- et voila

- select menu file > url and paste the url you just copied. Delft3D-Quikcplot will now download the meta-information from the OPeNDAP server. Even if when the underlying file would be a hundreds of GB, this step is always very fast.


