Concept
The Global Flood Monitor (GFM) of Flootags maps the cities around the world which are being hit by a flood in real-time based on twitter messages (see Figure 1, left). The GLObal Flood Forecasting Information System (GLOFFIS) is a global hydrological forecasting system that forecasts river runoff for 1 to 14 days in advance based on external forecasts of precipitation for the entire world, with a resolution of 1 degree (see Figure 1, right). By linking both systems, we can create flood alerts based on real-time ground-truth information about flooding combined with forecasted runoff which will give a idea of how much more flooding is to come. At the same time we can learn from ground-truth flood information about the threshold in simulated runoff at which riverine flooding occurs.

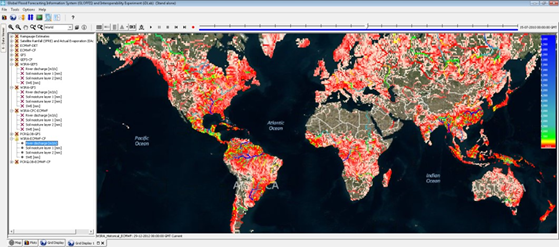
Figure 1. Global Flood Monitor (GFM), Flootags (left); and GLObal Flood Forecasting Information System (GLOFFIS), Deltares (right)
The cities of for which tweets are being monitored in GFM are based on the populated places (cities) database from the Natural Earth Data. We classified these cities according to their exposure to different types of flooding in: riverine flooding, coastal flooding, or riverine and coastal flooding, based on their location. For those cities exposed to riverine flooding (about 40% of the populated places according to our analysis), we paired a flow measuring station from the Global Runoff Data Centre (GRDC) in the same floodplain, with the city. For these measuring stations we have real-time and forecasted flow from GLOFFIS, and measured runoff from the GRDC dataset. The runoff data is normalized per station to make the data more informative. The normalized flow conditions are expressed as the percentage of time over the last 30 years during which the modeled runoff was lower than current modeled runoff. In this way, for each city susceptible to riverine flooding (based on the paired station) we can get real-time and forecasted normalized flow conditions. This information can be presented in the global flood monitor together with ground truth flood observations.
Case study: Louisiana, March 2016
In order to test this approach, we analyzed a flood that took place in March 2016 in Louisiana, Southern United States. The flood was widely reported in the news and had several mentions in the GFM (see Figure 2).
“The top rainfall total from this multi-day heavy rain event last week was just shy of 27 inches just south-southeast of Monroe, Louisiana. The official airport reporting station in Monroe had picked up 20.66 inches of rain from March 8-11. Incredibly, in just four days, this set a record for the wettest month in Monroe, outpacing October 2009 when 20.56 inches was recorded. Including rainfall from earlier in the month and on Sunday, Monroe has seen 21.35 inches since March 1. In just six days, the cooperative station outside of Monroe (26.96 inches), picked up half the average annual precipitation of Monroe's Regional Airport (53.71 inches).” source: weather.com
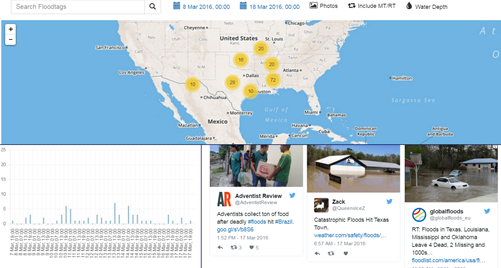
Figure 2. Global Flood Explorer zoomed into the USA for March 2016


Figure 3. Photos of the flooding in Monroe in March 2016. Source left image, right image
The city of Monroe is located in Louisiana State and the Ouachita River flows through the city. There is a GRDC station in the city called Monroe, which was automatically paired to the city as earlier explained. The flow conditions for Monroe city in the week of 8th-15th March 2016 were looked up by an automated script in the GLOFFIS system. Figure 4 presents the simulated flow at Monroe station as simulated by GLOFFIS. We can see that our global hydrological model simulated quite extreme conditions, i.e. a flow that has been exceeded by only 0.7% of the historical flows.
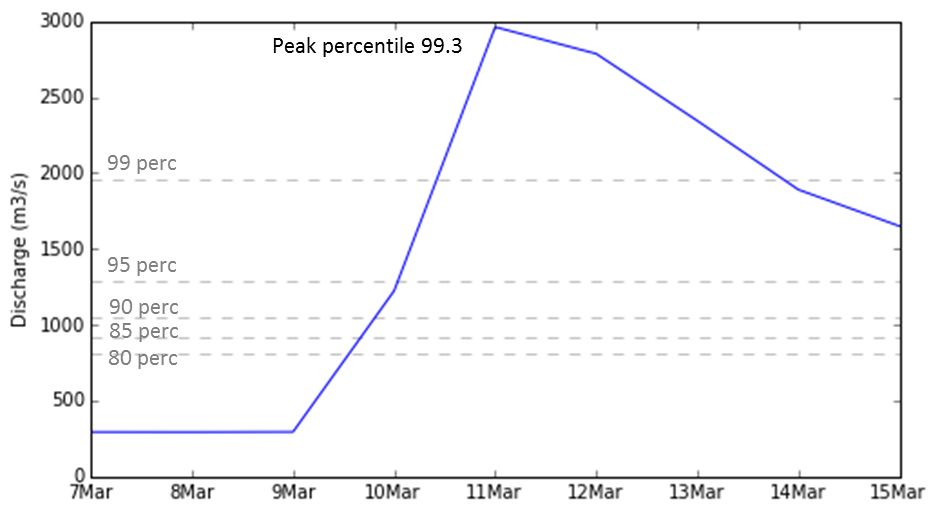
Figure 4. Simulated flow for Ouachita river at Monroe station (GLOFFIS results)
Next steps
After this proof of concept we will now automate the link between social media flood observations and modeled runoff. The results will be presented together in a webviewer. A first mockup of how this could look like is shown in Figure 5. Recently a similar system to GLOFFIS has been developed at Deltares to forecast storm surge levels on sea called GLOSSIS. When further developed, this system could be added to the GFM to provide similar flood information for coastal cities.

Figure 5. Mockup improved Global Flood Monitor with linked ground-thruth and simulated hydrological data