| Wiki Markup |
|---|
{scrollbar} |
| Table of Contents |
|---|
| Children Display |
|---|
...
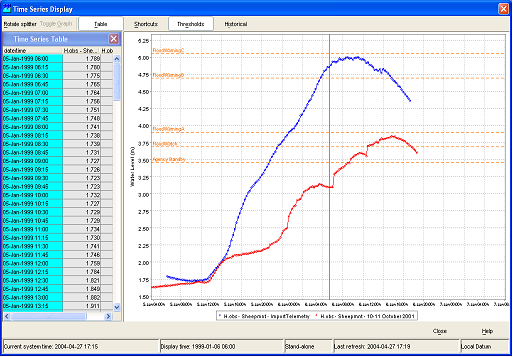
Data is displayed in a table and a graph simultaneously. The splitter between the table and the graph can be moved to modify the display. Select the data series, that should be displayed with help of the List Boxes and/or the Map Display (see also Filters ).
Wiki Markup
1.1 <ac:structured-macro ac:name="anchor" ac:schema-version="1" ac:macro-id="bdef10cc-088f-40da-959a-e8e405270663"><ac:parameter ac:name="">_Toc172823841</ac:parameter></ac:structured-macro><ac:structured-macro ac:name="anchor" ac:schema-version="1" ac:macro-id="61a28542-3193-470c-9704-bfb295fbce9d"><ac:parameter ac:name="">_Toc140564169</ac:parameter></ac:structured-macro>Data Display
Press the \[*Data Display* \] button !image002.png! on the toolbar to present graphs displaying the data. The splitter is normally positioned on the left of the
| Anchor | ||||
|---|---|---|---|---|
|
| Anchor | ||||
|---|---|---|---|---|
|
Press the [Data Display ] button
 on the toolbar to present graphs displaying the data. The splitter is normally positioned on the left of the display.
When data series of different data types have been selected, the data will be presented in different subplots with the data series of a single data type merged into one subplot.
...
With this button historical events can be activated (provided that they are pre-configured). They will be displayed in the same graph to enable a comparison with the actual timeseries. Further explanation is given below.
Display time
Wiki Markup

Datum Toggle
The Datum Toggle at the lower right hand corner of the display allows levels to be displayed with reference to Local Datum or mAOD .
...
- Black: original data
- Blue: corrected (original data flagged "Unreliable" and interpolated)
- Magenta: completed (original data missing and interpolated)

Wiki Markup
Wiki Markup
Historic Events
...
- Select the location from the location list box in the FEWS explorer
- Select the parameter from the parameter list box
- Open the chart display by pressing the chart button
- Press the
 button in the Chart Display and select one of the historical events from the list
Wiki Markup
Wiki Markup
Longitudinal profile
Since release 2007.02, the display offers also the opportunity to show longitudinal profiles. In such graph, the parameter values (Y-axis) are plotted against the river chainage (X-axis). The graph can progress over time, eitehr step by step or animated, via the time control toolbar, described in the Spatial display. both the graph and table will change over time as they shown data along the profile. 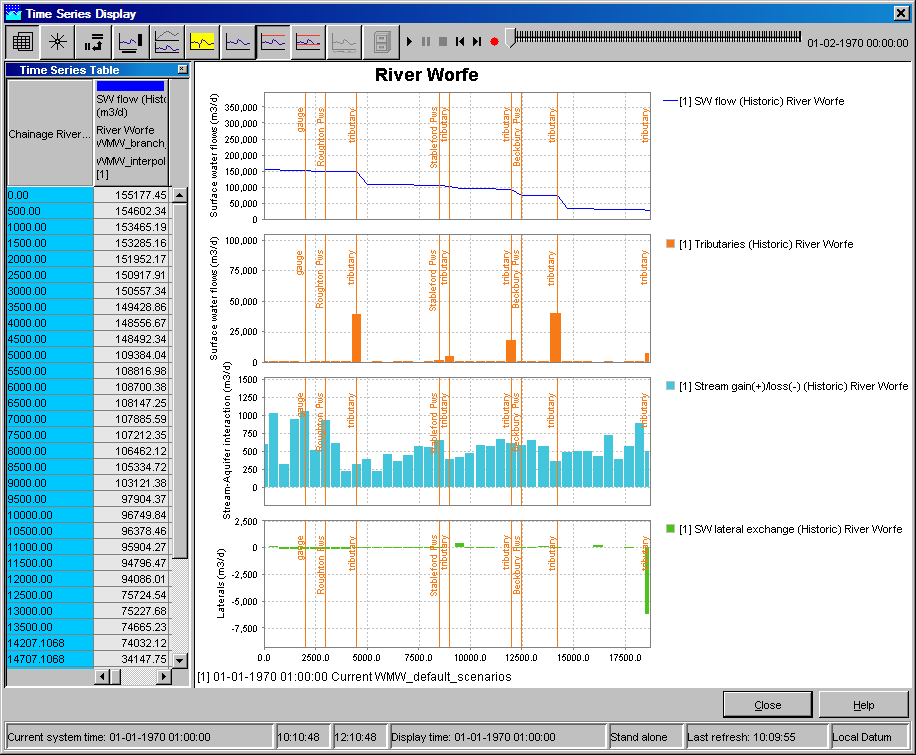
...