| Wiki Markup |
|---|
{scrollbar} |
| Table of Contents | ||||
|---|---|---|---|---|
|
...
| Children Display |
|---|
Report Module Configuration
...
Additionally, if singleLocation is true, then outputFileName can contain location attribute ids, e.g. "H_ (BASIN)", where tags between "@" signs refer to location attributes that are defined in the locationSets config file. These tags will be replaced with the corresponding attribute values of the location of the report. These values can be different for different locations. See 22 Locations and attributes defined in CSV files, Shape-DBF files or external tables for more information. If required to use a "@" sign in this element without using locationAttributes, then need to add an extra escape character "@" before each "@" sign. In other words "@@" is replaced with a single "@" sign.
It's also possible to generate a Timeseries based postfix in the filename using the %TIMESERIES_POSTFIX% tag. An optional dateFormat id can be specified. For example:
%TIMESERIES_POSTFIX(dateFormat)% where dateFormat is the id of a dateFormat as specified in the reports declarations.
If no dateFormat is passed: %TIMESERIES_POSTFIX%, the default date format ddmmyyyym will be used.
DefineLocal
The DefineLocal element can be used to enter some information that is valid for a single report. Multiple DefineLocal elements may be defined, as long as the ID attribute is kept unique.
...
Below are two examples of a config and the resulting plot.
|
|

...
Below an configuration and resulting plot
|
| |||||||
|
|


...
- The overlayFormat is used for positioning location and/or warning icons on the map based on:
- The map itself (defined in mapFormat);
- X and Y coordinates of the required locations from the Locations.xml;
Note that in case of numbers bigger than 999, it can be that the output may contain unwanted commas, e.g. width 1274 is printed in the reports as 1,274. In order to avoid this, it is recommended to use
Code Block {<position>, number, #}instead of
Code Block {<position>, number}.
- Note that when providing a single quote within a snippet of javascript of OverlayFormat in a format field of the report XML configuration and the report appears to be missing this single quote character, this can be fixed by adding the additional escape character in the form of an additional single quote. A more verbose alternative is to put '' or ''.
...
A clickable map is an image on a html page containing 'hot spots' where the cursor change from the normal 'arrow' to a 'pointing finger' during a mouse-over event. These hot spots can contain hyperlinks to other pages.
mapFormat |
|
|---|
...
The part describing the hot spots for this map are defined in the [map] tag. In this example below, three areas are 'clickable'. Every hot spots links to another html page in the set of reports.
| No Format |
|---|
<img border="0" src="northeast.png" width="503" height="595" *usemap="#clickmap"*>

<!-- Here the clickable map starts: SHOULD BE IN THE TEMPLATE -->
<map name="clickmap">
<area alt="Northumbria Area" href="northumbria/area_status.html" shape="polygon" coords="138, ...,...,34">
<area alt="Dales Area" href="dales/area_status.html" shape="polygon" coords="266, ..., ..., 285">
<area alt="Ridings Area" href="ridings/area_status.html" shape="polygon" coords="359, ..., ..., 379">
</map>
|
...
Hyperlinks can be added to the overlayFormat. By using the following option, hyperlinks to individual reports will be added automatically. They will have a fixed (non-configurable) name, "forecastlocation.html" and assuming it is located in a directory with the same name as the locationId compared to where this report with the map is located in the directory structure.
overlayFormat |
|
|---|
When adding href="{5}" to the overlayFormat (at that location) a hyperlink is being added to the icon placed on the map. In html it will look like this.
| No Format |
|---|
<!-- map -->
<div style="TOP:160px;LEFT:5px;position:absolute;Z-index:0">
<img border="0" src="derwent.png" width="503" height="578" usemap="#clickmap">
</div\>

<!-- icons -->
<div style="TOP:467px;LEFT:427px;position:absolute;Z-index:1">
<a href="BOYNTN1/forecastlocation.html"><img border="0" src="fluvial_site_data.gif"
title="Boyntn1: No threshold exceeded"></a>
</div>
|
...
Configuration example:
| Code Block | ||||
|---|---|---|---|---|
| ||||
<flagCountsTableFormat id="flagCountsTableFormat">
	<tableStyle>tableStyle1</tableStyle>
	<hyperlinkUrl>report.html#!LOCATION_NAME!_!PARAMETER_NAME!</hyperlinkUrl>
</flagCountsTableFormat>
|
...
Configuration example:
| Code Block | ||||
|---|---|---|---|---|
| ||||
<flagCountsTable id="flagCountsTable" formatId="flagCountsTableFormat">
	<inputVariableId>Cowbeech</inputVariableId>
	<inputVariableId>Romsey</inputVariableId>
	<inputVariableId>CrosslandsDrive</inputVariableId>
</flagCountsTable>
|
...
Configuration example:
| Code Block | ||||
|---|---|---|---|---|
| ||||
<flagSourceCountsTableFormat id="flagSourceCountsTableFormat">
	<tableStyle>tableStyle1</tableStyle>
</flagSourceCountsTableFormat>
|
...
Configuration example:
| Code Block | ||||
|---|---|---|---|---|
| ||||
<flagSourceCountsTable id="flagSourceCountsTable1" formatId="flagSourceCountsTableFormat">
	<inputVariableId>Cowbeech</inputVariableId>
</flagSourceCountsTable>
|
...
An example Schematic status Display that contains the following configuration,
| Code Block | ||||
|---|---|---|---|---|
| ||||
	<dateFormat id="DF1">
		<timeZone>
			<timeZoneName>CET</timeZoneName>
		</timeZone>
		<dateTimePattern>dd-MM-yyyy</dateTimePattern>
	</dateFormat>
	<numberFormat id="NF1">
		<pattern>{0,number,##0.00}</pattern>
	</numberFormat>
|
must be transferred to the report declarations. The definitions of the date format and number format cannot be copied directly to the report configuration since they have a slightly different format.
| Code Block | ||||
|---|---|---|---|---|
| ||||
<?xml version="1.0" encoding="UTF-8"?>
<reports xmlns="http://www.wldelft.nl/fews" xmlns:xsi="http://www.w3.org/2001/XMLSchema-instance" xsi:schemaLocation="http://www.wldelft.nl/fews http://fews.wldelft.nl/schemas/version1.0/reports.xsd" version="1.0">
<declarations>
	<defineGlobal id="ForecastingRegion">IWP-Twentekanalen</defineGlobal>
	<dateFormat id="DF1">
		<timeZone>
			<timeZoneName>CET</timeZoneName>
		</timeZone>
		<pattern>dd-MM-yyyy</pattern>
	</dateFormat>
	<numberFormat id="NF1">{0,number,##0.00}</numberFormat>
		...
</declarations>
<report>
...
// Add Ssd report elements here for generating Avi, Gif, Png or Svg.
...
</report>
</reports>
|
...
schematicStatusDisplayPanelAvi

| Code Block | ||||
|---|---|---|---|---|
| ||||
		<schematicStatusDisplayPanelAvi id="ssdAvi">
			<scadaPanel id="TK" name="Twentekanalen 10 min">
				<svgFile>Twentekanalen.svg</svgFile>
				<nodeId>Twentekanalen Hydro</nodeId>
				...
			</scadaPanel>
			<width>1024</width>
			<height>800</height>
			<relativePeriod unit="hour" start="-20" end="4"/>
			<timeStep unit="second" multiplier="300"/>
			<movieFrameDurationMillis>200</movieFrameDurationMillis>
			<fileName>SSD_test.avi</fileName>
		</schematicStatusDisplayPanelAvi>
|
...
schematicStatusDisplayPanelAnimatedGif
| Code Block | ||||
|---|---|---|---|---|
| ||||
		<schematicStatusDisplayPanelAnimatedGif id="ssdGif">
			<scadaPanel id="TK" name="Twentekanalen 10 min">
				<svgFile>Twentekanalen.svg</svgFile>
				<nodeId>Twentekanalen Hydro</nodeId>
				...
			</scadaPanel>
			<width>1024</width>
			<height>800</height>
			<relativePeriod unit="hour" start="-20" end="4"/>
			<timeStep unit="second" multiplier="300"/>
			<movieFrameDurationMillis>200</movieFrameDurationMillis>
			<fileName>SSD_test.gif</fileName>
		</schematicStatusDisplayPanelAnimatedGif>
|
...
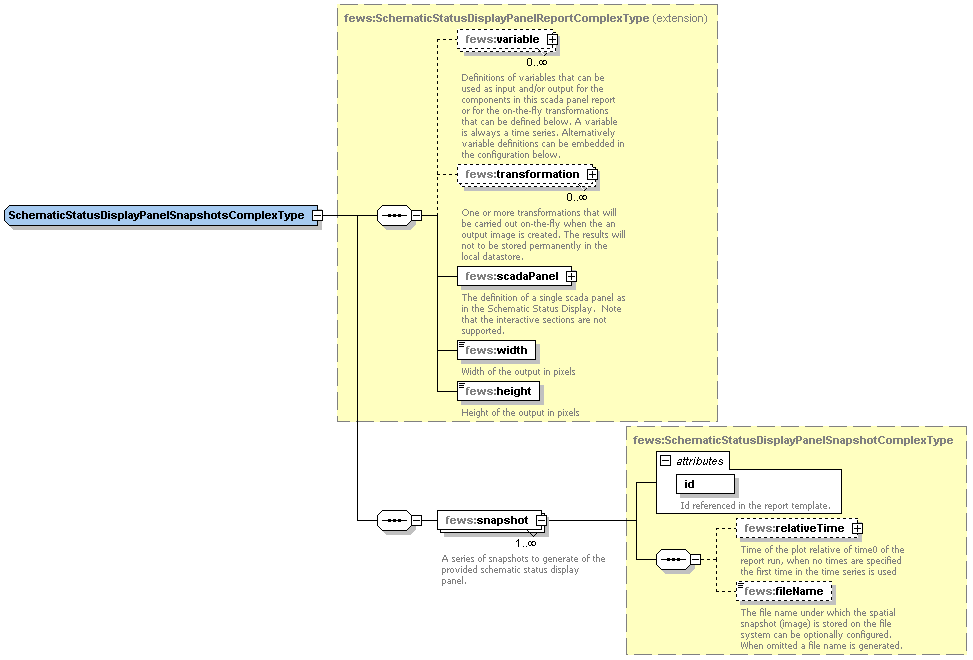
Sample demonstrating use of creating png snapshots that includes Schematic Status Display transformations:
| Code Block | ||||
|---|---|---|---|---|
| ||||
	<schematicStatusDisplayPanelSnapshotsPng>
		<variable>
			...
		</variable>
		<transformation id="UserSimpleTransformation">
			<user>
				<simple>
					<expression>Waterstanden_10min * 100</expression>
					<outputVariable>
						<variableId>Waterstanden_10min_times_100</variableId>
					</outputVariable>
				</simple>
			</user>
		</transformation>

		<scadaPanel id="TK" name="Twentekanalen  10 min">
....
		</scadaPanel >
		<width>1024</width>
		<height>800</height>
		<snapshot id="ssd1">
			<relativeTime unit="hour" value="-4"/>
			<fileName>SSD_test1.png</fileName>
		</snapshot>
		<snapshot id="ssd2">
			<relativeTime unit="hour" value="-3"/>
			<fileName>SSD_test2.png</fileName>
		</snapshot>
	</schematicStatusDisplayPanelSnapshotsPng>
|
...
schematicStatusDisplayPanelSnapshotsSvg
| Code Block | ||||
|---|---|---|---|---|
| ||||
	<schematicStatusDisplayPanelSnapshotsSvg>
		<scadaPanel id="TK" name="Twentekanalen  10 min">
....
		</scadaPanel >
		<width>1024</width>
		<height>800</height>
		<snapshot id="ssd1">
			<relativeTime unit="hour" value="-4"/>
			<fileName>SSD_test4.svg</fileName>
		</snapshot>
		<snapshot id="ssd2">
			<relativeTime unit="hour" value="-3"/>
			<fileName>SSD_test5.svg</fileName>
		</snapshot>
	</schematicStatusDisplayPanelSnapshotsSvg>
|
...
Example of the configuration in <report> section:
| Code Block |
|---|
<report>

        <locationSetId>AllLocations</locationSetId>

        <rowPerLocationHtmlTable id="tableA" tableStyle="tableStyle3" >


	    <column>
		<header>Locatie id</header>
		<format>_data</format>
		<function>LOCATIONATTRIBUTE(id)</function>
	    </column>

           <column>
	  	<header>Locatie name</header>
	  	<format>_data</format>
		<width>200</width>
	  	<function>LOCATIONATTRIBUTE(name)</function>
	    </column>

            <column>
	 	<header>Eenheid</header>
	 	<format>_data</format>
	 	<function>PARAMETERATTRIBUTE(UNIT;Qobserved)</function>
	    </column>


             <column>
	    	<header>Datum 1e overschrijding</header>
	    	<format>_data</format>
	    	<function>THRESHOLDCROSSING(FIRST_DATE;Qobserved;dateFormatThreshold)</function>
	    </column>

            <column>
	    	<header>Tijdstip 1e overschrijding</header>
	    	<format>_data</format>
	    	<function>THRESHOLDCROSSING(FIRST_TIME;Qobserved;timeFormatThreshold)</function>
	    </column>

            <column>
		<header>Waarde 1e overschrijding</header>
		<format>_data</format>
		<function>THRESHOLDCROSSING(FIRST_VALUE;Qobserved;numberFormatThreshold)</function>
	    </column>


             <column>
	    	<header>Datum maximale overschrijding</header>
	    	<format>_data</format>
	    	<function>THRESHOLDCROSSING(MAX_DATE;Qobserved;dateFormatThreshold)</function>
	    </column>

             <column>
	    	<header>Tijdstip maximale overschrijding</header>
	    	<format>_data</format>
	    	<function>THRESHOLDCROSSING(MAX_TIME;Qobserved;timeFormatThreshold)</function>
	    </column>

 	   <column>
		<header>Waarde maximale overschrijding</header>
		<format>_data</format>
		<function>THRESHOLDCROSSING(MAX_VALUE;Qobserved;numberFormatThreshold)</function>
	    </column>


        </rowPerLocationHtmlTable>

        <template>ReportRowPerLocationTable.html</template>

        <outputFileName>tableA.html</outputFileName>
</report>
|
Example of the configuration in <declarations> section:
| Code Block |
|---|
<declarations>
	  <rowPerLocationHtmlTableFormat id="rowPerLocationFormat1" tableStyle="tableStyle3" >

  	   <column>
	  	<header>Naam</header>
	  	<format>_data_yellow</format>
		<function>LOCATIONATTRIBUTE(shortname)</function>
	    </column>

	       <column>
	    	<header>Tijd maximale overschrijding</header>
	    	<function>THRESHOLDCROSSING(MAX_DATETIME;Qobserved;dateFormat1)</function>
	     </column>


	       <column>
	    	<header>Waarde maximale overschrijding (m3/s)</header>
	    	<function>THRESHOLDCROSSING(MAX_VALUE;Qobserved;numberFormat1)</function>
	     </column>

	     <column>
	     	 <header>Tijd maximale waterstand</header>
	         <function>MAXTIME(Hobserved;dateFormat1)</function>
	     </column>

	     <column>
	     	 <header>Maximale waterstand (m)</header>
	         <function>MAXVALUE(Hobserved;numberFormat1)</function>
	     </column>

	  </rowPerLocationHtmlTableFormat>
</declarations>
|