...
The interval statistics dialog will appear after selecting time series from the database viewer and selecting "show statistics intreval" from the right click context menu. is a predefined display that needs to be configured as an ExplorerTask in Explorer.xml:
| Code Block |
|---|
		<explorerTask name="Interval Statistics">
			<predefinedDisplay>interval statistics</predefinedDisplay>
			<toolbarTask>true</toolbarTask>
			<menubarTask>true</menubarTask>
			<loadAtStartup>true</loadAtStartup>
</explorerTask> |
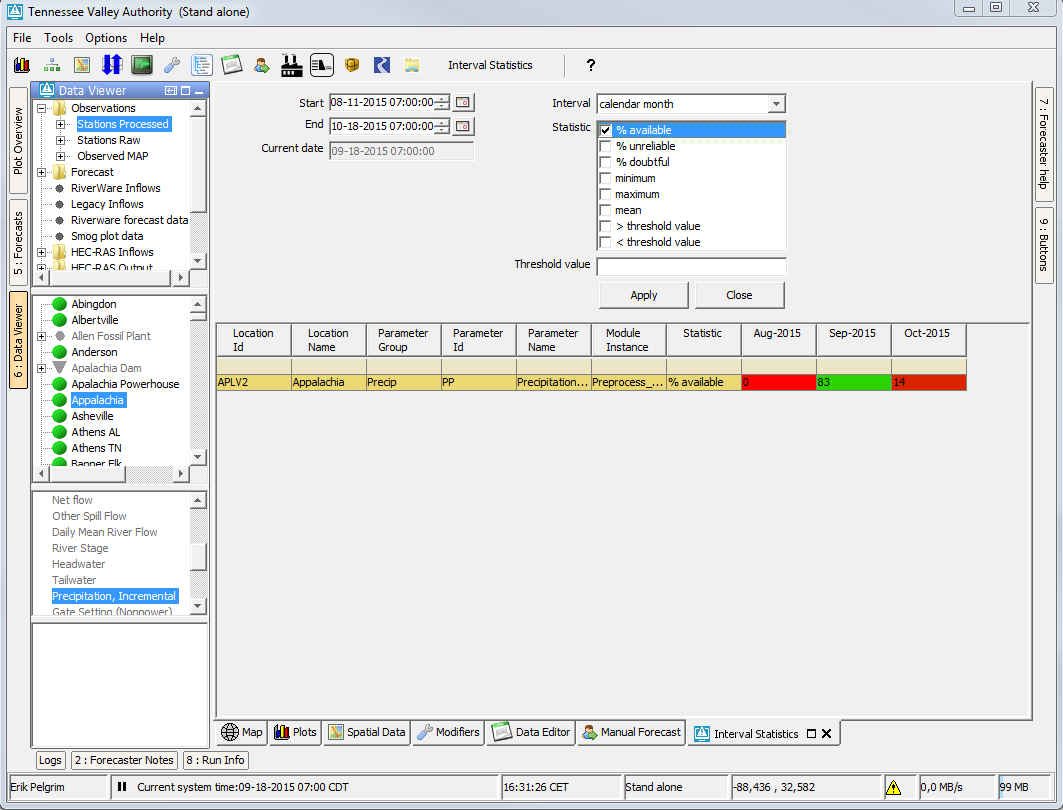
This dialog will enable the user to divide the selected time series from the data viewer into specific intervals intervals between a specific start and end date and calculates statistical values for those intervals. The example below shows the percentage of non missing values for each week daycalendar month between start and end date:

A different interval can be chosen from a dropdown list, like monthyear
 :
:
By selecting the checkbox "calendar units" interval month, the intervals will be a unique period on a calendar:

When interested in a smaller period, this can be chosen by changing the start and end dates in the selection boxes:
 divided over the 12 months within a year. This means for example that the data from September 2014 and September 2015 is taken together in the column Sep.
 :
:
The threshold value field can be filled and will be used when calculating the percentage of values above or below a threshold. This is shown below where also the interval year is chosen:


Multiple time series Multiple statistics can be selected at once, this will result in multiple rows:
 per time serie. This is shown below for just 1 time serie, where the Multiple statistics can be chosen as well for example minimum, maximum and mean are chosen::

Multiple time series and multiple statistics can be chosen, this will result in a new row for each time series for each each statistic:
The rows can be oredered by clicking on the table header, for example Location Id:

