| Table of Contents |
|---|
Spatial Display
The Spatial Display grid display can be used to display time series of any type: scalar, polygon or grid. The display will depict the data on a map background. The display time is then set using a ruler that can be moved manually or made to move automatically.
...
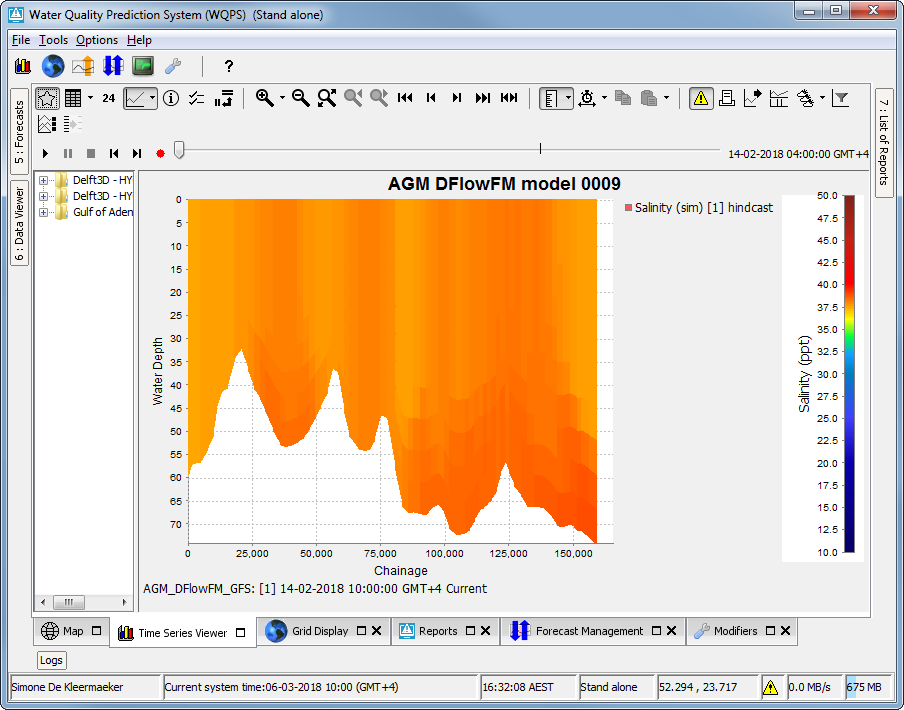
Create a 2D longitudinal profile on the fly for 3D data a in the spatial display. Start drawing a longitudinal profile with a CTRL-click in the spatial display and click to add points as required. Finish the profile with a double-click for the last point. Open up the longitudinal profile in the timeseriesdisplay with CTRL-F11, or via the context menu.
Note, this feature only works for
- data within 1 grid partition. In some cases 3D data model runs are run on multiple domain partitions. This data can be shown as a 2D longitudinal profile, but only if the profile remains within a single domain.
- scalar data (e.g. Water temperature or salinity), and not yet for vector data like currents.

Extracting data for an area from a grid time series (available since build 18645)
For certain types of data it is possible to extract time series data for a specific part of a grid and show this in a separate graph. This is only possible for scalar data with dimension L3/T, L3, L/T, L or 'amount of substance' and for horizontal flow data with dimension L3/T or L/T. The specific part of the grid is defined by drawing an area sketch (a closed polygon surrounding the desired area). Start drawing an area sketch either by right clicking and selecting 'Start Drawing Area' from the pop-up menu or by Shift+left clicking on an edge for the desired area. A coloured dot will be drawn to indicate the selected point. Add additional line segments along the edge of the desired area by left clicking in the display. Finish drawing by double-clicking. The last point in the sketch will be connected to the first point automatically to create a closed polygon that surrounds the desired area. Each grid cell inside the area is marked with a green dot.
Once an area sketch has been drawn, extract the desired data by right clicking and selecting 'Calculate Budget' from the pop-up menu. The corresponding graph will show automatically. The 'Calculate Budget' option will perform one of the following calculations, depending on the type and the dimension of the selected data (The dimension can be defined in a parameterGroup in the region configuration).
...