Contents
| Table of Contents |
|---|
Which displays are used in
...
the IFD?
The IFD is short for Interactive Forecast Displays.
The IFD is a set of displays which enable the forecaster to create a forecast manually in comparison to a batch run which creates a forecast in a background process triggered either by a schedule or manually.
When a forecaster creates a forecast in the IFD, the forecast created in the background process is usually used as the starting point for the forecaster.
The forecaster validates the results from the server run and adjusts the forecast by using modifiers where needed.
When the forecaster is satisfied with the adjusted forecast the forecast is finalized and published to other forecasters.
Usually when creating a forecast by using the IFD, FEWS runs in a mode where all the windows are dockable.
This is an important aspect of the IFD because this feature enables the forecaster to keep an overview of the system.
Contents
| Table of Contents |
|---|
Which displays are used in the IFD?
The IFD consists of several panels.
Each of these panels has a specific role in the process of creating a forecast with the IFD.
In this chapter the functionality of each panel in the IFD will be explained.
In the next chapter will be explained with a use case how a forecast can be created with the
IFD by using the combined functionality of the separate panels.
Forecast panel
consists of several panels.
Each of these panels has a specific role in the process of creating a forecast with the IFD.
In this chapter the functionality of each panel in the IFD will be explained.
In the next chapter will be explained with a use case how a forecast can be created with the
IFD by using the combined functionality of the separate panels.
Forecast panel

The forecast panel plays a central role in creating a forecast in the IFD.
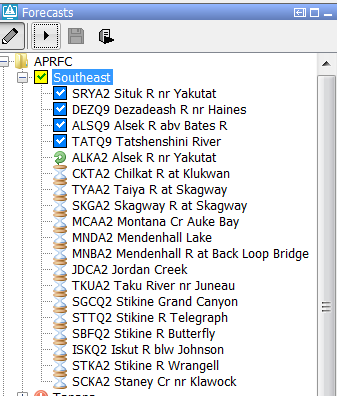
The forecast panel usually shows a tree with all the forecast points for a region and the grouping of these forecast points.
It is also possible to show the work process of a forecaster in the forecast panel.
Each node in the forecast panel can be used to start a workflow and view the results of that run. In some cases nodes it can be usefull to define nodes without a workflow so they can
be used just for viewing purposes.
Button bar
The top of the forecast panel shows a button bar. By default this button bar will look like this.

The pencil icon indicates that the IFD is edit-mode, this means that the forecaster is allowed to create modifiers.
By pressing this button the IFD can be set in read-only mode.
The second icon can be used to start runs in IFD-mode. When a leaf node is selected the workflow of the selected node will run.
When a group node is selected all the leaf nodes of that group will be started.
The save icon can be used to promote a local IFD run to a server run. The last button can be used to start a run at a FSS.
The first IFD FEWS systems had a button bar which looked like this. This original bar can be activated by using the topology.xml.

The pencil button can be used to switch between edit-mode and readonly-mode. The second arrow button is used to step to the next leaf node in the topology tree.
The third button is used to start a workflow in IFD mode. The fourth button is only activated when a group node is selected. It can be used to start all the workflows of the group node in IFD-mode.
The first leaf node of the group node will be started first. The fourth button start a workflow in server mode. The last button updates the system time to the current time.
Icons
Running and scheduled workflows
A workflow which is running locally or at the server will be indicated by an arrow icon. A workflow which is scheduled to run will be indicated by a hourglas icon.
Succesfull run
The tree in the forecast panel shows the tree as it is configured in the topology.xml. For the nodes which have a workflow configured the icon shows the status of the current run of that node.
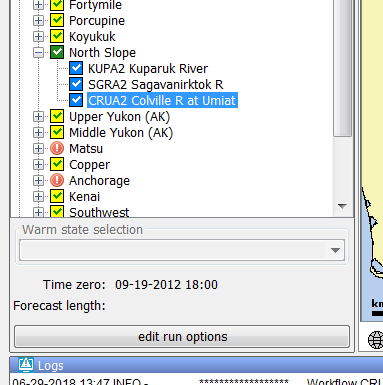
If a workflow was fully succesfull the node will have a blue or green icon.
A local succesfull run will be indicated by a blue icon a succesfull server run will be indicated by a green icon.
In the example below a server run has run succesfully for node North Slope. For the leaf nodes KUPA2, SGRA2 and CRUA2 a succesfull IFD run was executed.
If the time zero of a node is different than the time zero which was used in the succesfull run then the icons will be different.
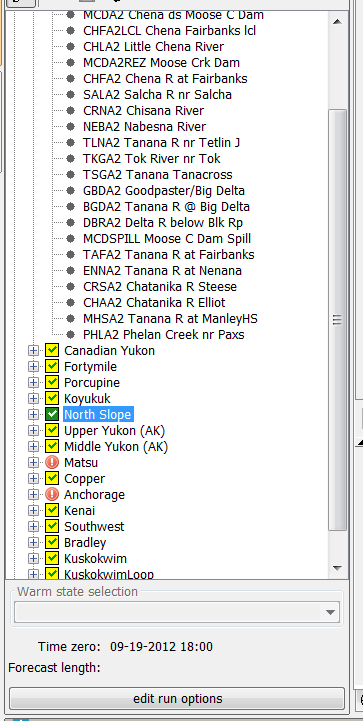
Succesfull run with a different time zero
The example below shows a screenshot of the same FEWS system as shown above but now with a different time zero.

The icons are grey instead of green and blue and the check marks are now blue and green.
Failed run
A failed run is indicated by an icon with an exclamation mark. If the time zero of the failed run is equal to the time zero of the node the exclamation mark will be red otherwise it will be black.
In the example below the node Matsu has a failed run with a time zero equal to the time zero of the IFD (09-19-2012).
In the example below a screen shot is shown of the same system but the time zero is now shifted to 09-20-2012.

The red exclamation marks are now black because the time zero of the failed runs is not equal anymore to the time zero of the IFD.
Modifiers
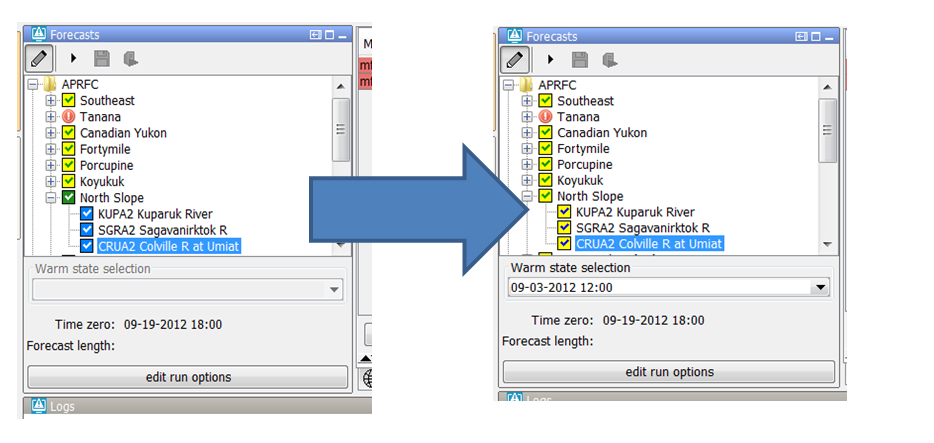
When a modifier is made at a node with a local succesful run then the icon will change to a yellow icon to indicate that the workflow of that node needs to rerun.
In the example below a modifier was made to the node CRUA2.

State selection
If the user changes the state selection in the IFD so that the state selection doesn't match the state selection anymore the icons will turn yellow.
An example is shown below
 The forecast panel plays a central role in creating a forecast in the IFD.
The forecast panel shows a tree with all the forecast points for a region and the grouping of these forecast points.
Each node in the tree can be linked to a workflow. For example node EAGLE NEST DAM has its own workflow.
Each node also shows the current status of the last run of the workflow to which the node refers.
Workflows of parent nodes are always run by default on the server. By default Workflows of leaf nodes run by default locally. These default settings can be changed in the topology.xml.
are locally run, however it is also possible that these workflows are run on the server.
This can be done by setting the optional tag localRun to false for a node.
The leaf nodes are indicated by the small black balls in the display, parent nodes (node containing other parent nodes or leafs) are indicated as a folder in the forecast display. When a leaf node is selected the ifd will automaticly run the workflow of that node.
This behaviour can however be disabled in the configuration by setting the enableAutoRun-tag to false in the topolog.xml. 
If the node shows a green checkbox (as is seen in the image above at the node DIVERSIONS-CO) item it means that the workflow has run successfully.
A red exclamation (as is seen in the image above at the LEADVILLE node) mark indicates that the workflow is failed.
A yellow ball indicates that the workflow was successful in a prior run, but the results have since been invalidated by some upstream change.
For example, when the forecaster has created a modifier but did not rerun the workflow yet.
Or when an upstream node was run later than one off its downstream nodes then the results of the downstream nodes are set to invalid.
When a folder is shown for a parent node (as is seen for the COLORADO node in the image below) or a black ball for a leaf node (as is seen in the MALTA 5SE node) then the workflow has not run yet for the current time zero.
...
The file-menu also provides an option default layout. By selecting this option the default layout can be reloaded.