...
An example is shown below
...
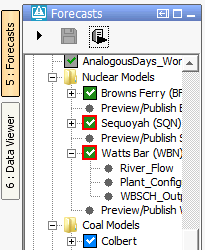
Workflows of parent nodes are run by default on the server. Workflows of leaf nodes run by default locally. These default settings can be changed in the topology.xml.
The leaf nodes are indicated by the small black balls in the display, parent nodes (node containing other parent nodes or leafs) are indicated as a folder in the forecast display.
If the node shows a green checkbox (as is seen in the image above at the node DIVERSIONS-CO) item it means that the workflow has run successfully.
A red exclamation (as is seen in the image above at the LEADVILLE node) mark indicates that the workflow is failed.
A yellow ball indicates that the workflow was successful in a prior run, but the results have since been invalidated by some upstream change.
For example, when the forecaster has created a modifier but did not rerun the workflow yet.
Or when an upstream node was run later than one off its downstream nodes then the results of the downstream nodes are set to invalid.
When a folder is shown for a parent node (as is seen for the COLORADO node in the image below) or a black ball for a leaf node (as is seen in the MALTA 5SE node) then the workflow has not run yet for the current time zero.
...
A green arrow (as is seen in the node TURQUOISE LAKE) indicates that the workflow is currently running (locally or at server).
An hour glass (see node HALFMOON above) indicates the workflow is scheduled to run.
...
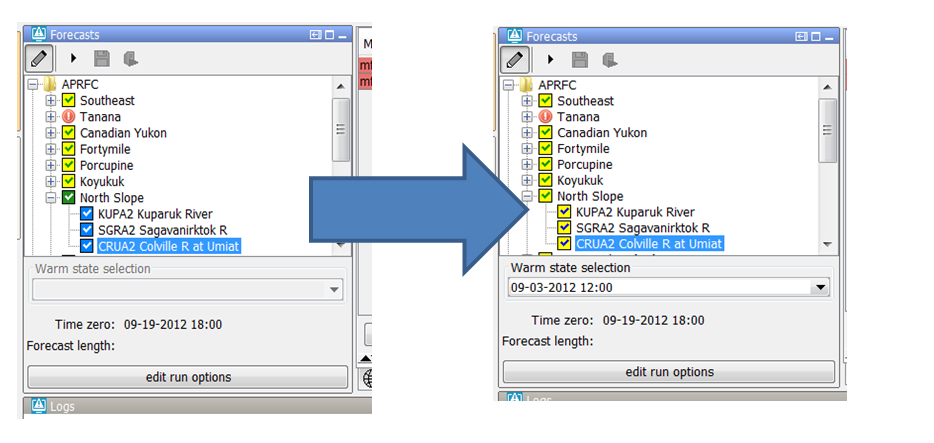
As part of 2014.02, the color of the forecast icons has changed (see figure below).
![]()
We still have the green and blue boxes with the white check marks. They represent a server (green) or local (blue) run, with the same T0 and state settings as shown in the IFD.
Prior to 2014.02 you would not see an icon at all if the T0 in the IFD was different than the T0 of the approved run in the database, or if the state settings in the IFD were different than the state settings of the approved run in the database. For releases starting with 2014.02, you will see multiple icons for the various situation:
A grey box with either a green or blue check mark. A grey box means the T0 of the approved run in the database is different than the one in the IFD. The check mark indicates whether the approved run is a local or a server run.
A yellow box with either a green or blue check mark. A yellow box means the state settings of the approved run in the database are different than the settings in the IFD. For example you might have a different warm state, warm state search interval, or forecast length. The check mark indicates whether the approved run is a local or a server run."

As of 2016.01, The IFD status icon can be surrounded by a red outline. See figure below. This red outline surrounding the IFD status icon indicates that the workflow task completed but not all of the data has been synchronised back to the operator client. This red outline feature is disabled for DDA clients as it pertains only to synchronisation in LDS clients.
As of 2016.01, The IFD status icon can be surrounded by a red outline. See figure below. This red outline surrounding the IFD status icon indicates that the workflow task completed but not all of the data has been synchronised back to the operator client. This red outline feature is disabled for DDA clients as it pertains only to synchronisation in LDS clients.
Go to next segmentAdjust T0
Run on ServerForecast/View-button

Re-Run button
At the top of the forecast panel several buttons are shown.
The first button is a Forecast/View toggle button (Put image of the button here) which can be used to switch from View mode to Forecast mode.
In the Forecast mode the forecaster can create modifiers and when a leaf node is selected the workflow is run automatically . In View mode the forecaster can view the results of other forecasts.
However, it is not allowed to create modifiers and workflows will not be run automatically when a node is selected. A workflow can be forced to run by pressing the Re-Run button.
The second button is the Go to Next Segment-button (image of button here). By pressing this button automatically the next leaf-node in the forecast panel will be selected.
The third button is the Re-Run-button (need button image). This button is only enabled when a node is selected which has a workflow which runs locally.
The fourth button is the 'Run on Server'-button (need button image here). This button is only enabled when a node is selected with a workflow which should run on the server.
The last button is the Adjust T0 (need image of button) button which allows the forecaster to adjust the current system time to the nearest cardinal time step prior to the current time.

At the bottom of the forecast panel there is a Run options section. In this section the forecaster can set the properties of the run. The warm state can be selected and the current Time zero is also displayed. More advanced options are available with the button Run options.
Modifiers panel
The modifiers panel is an important display in the IFD.
...