...
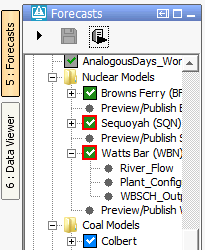
A workflow which is running locally or at the server will be indicated by an arrow icon. A workflow which is scheduled to run will be indicated by a hourglas icon.
Succesfull run
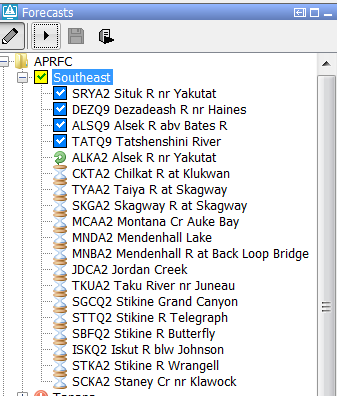
The tree in the forecast panel shows the tree as it is configured in the topology.xml. For the nodes which have a workflow configured the icon shows the status of the current run of that node.
...
If the time zero of a node is different than the time zero which was used in the succesfull run then the icons will be different.
Succesfull run with a different time zero
The example below shows a screenshot of the same FEWS system as shown above but now with a different time zero.
...
The icons are grey instead of green and blue and the check marks are now blue and green.
Failed run
A failed run is indicated by an icon with an exclamation mark. If the time zero of the failed run is equal to the time zero of the node the exclamation mark will be red otherwise it will be black.
...
The red exclamation marks are now black because the time zero of the failed runs is not equal anymore to the time zero of the IFD.
Modifiers
When a modifier is made at a node with a local succesful run then the icon will change to a yellow icon to indicate that the workflow of that node needs to rerun.
In the example below a modifier was made to the node CRUA2.

State selection
If the user changes the state selection in the IFD so that the state selection doesn't match the state selection anymore the icons will turn yellow.
...
As of 2016.01, The IFD status icon can be surrounded by a red outline. See figure below. This red outline surrounding the IFD status icon indicates that the workflow task completed but not all of the data has been synchronised back to the operator client. This red outline feature is disabled for DDA clients as it pertains only to synchronisation in LDS clients.
Task properties panel
Modifiers panel
The modifiers panel is an important display in the IFD.
...
For example when the forecaster selects the modifier type MFC and there are two SNOW17-models available in the segment, the forecaster should also specify to which models the modifier should be applied.
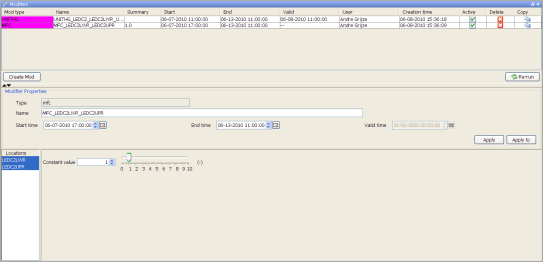
When the modifier can be applied to more than one model in a basin a 'location'-panel shows up at the left part of the details display. In this panel the forecaster can select to which locations the modifier should be applied.
The Re-run button runs the workflow from the selected node and the workflows from the upstream nodes.
The lower part of the display shows the details of the selected modifier or when the forecaster is creating a new modifier the details of the new modifier.
Topology panel
The topology panel shows the topology of the selected node. When a leaf node is selected the topology of the parent node is shown. When a parent node is selected the topology of its children is shown.
The colors of the boxes in the topology change when a threshold is passed. The color of the box and the thresholds which are monitored can be configured.

Plot
The plot display is used to show scalar time series. Each node has its own set of predefined displays configured. When a node is selected the plots display automatically updates the plots which are already displayed to show data for the new node. The first plot configured for the selected node is automatically shown in this display.
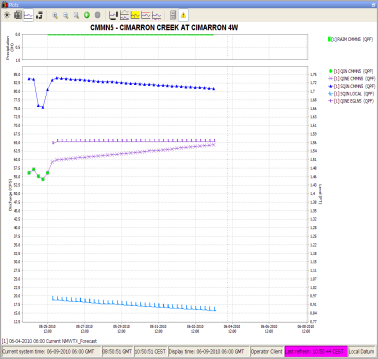
When the IFD is started, there is always at least one plot display available. This plot is called the primary plot display. The primary plot doesn't have lock icon at the left of the toolbar. When a new plot display is started this plot will have a lock icon at the left on the toolbar. When a new plot displayed is started, by default the plot will be locked.

When a plot is locked, the display is locked to that set of time series. When the forecaster moves from basin to basin, the plot will continue to display the original timeseries. The plot is not updated. However, as new data is brought in, the plot is updated with new data.
When the toggle-button is switched off (icon changes to unlock) the plot window is updated automatically when a new node is selected.
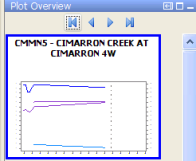
Plot overview
The plot overview is a panel which shows a thumbnail of each plot which is configured for the selected node. This panel gives an overview of the selected node. This overview is enabled by configuring the following task in the explorer tasks; nl.wldelft.fews.gui.plugin.displaythumbnails.ShortcutsThumbnailsDialog
When a plot is selected the primary plot is automatically updated, also other plots display which are not locked (see previous chapter) are updated. Primary plot is defined by including the following task in the explorer tasks: nl.wldelft.fews.gui.plugin.timeseries.PlotsTimeSeriesDialog. Is such task is not defined the Plot Overview works only if a time series dialog window is open.

At the top of the panel there are four buttons. The first button selects the first plot, the second button selects the previous plot, the third button selects the next plot and the last button selects the last plot.
Forecaster help
The forecaster help panel shows user provided documentation which is available for a node.
Currently the following formats are supported: textfiles, images and pdf-files.
Users can place documents in a directory within predefined directories.
These directories can be configured in the topology.xml configuration file by adding a forecasterHelperDirectories element that contains a directory element for all directories.
...
| Code Block |
|---|
<explorerTask name="Forecaster help"> <taskClass>nl.wldelft.fews.gui.plugin.information.ForecasterAidSelectionPanel</taskClass> </explorerTask> <explorerTask name="Documents viewer"> <taskClass>nl.wldelft.fews.gui.plugin.information.ForecasterAidDocumentPanel</taskClass> </explorerTask> |
Run info
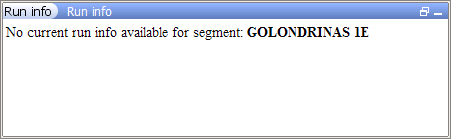
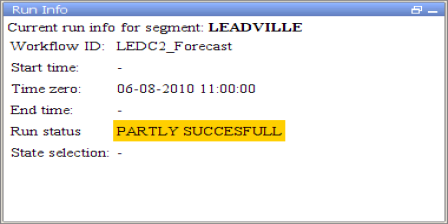
The run info panel shows detail information of the latest run of the workflow of the selected node.
If the workflow of the node has not run yet for the current T0 then the panel will show that there is no current run info available
...
When the run is partly successful the icon of that node will be set to the red exclamation mark, the run status box in the run info panel will be set to yellow. When the run is failed the icon of the node will be set to the red exclamation mark, the run status box will be set to red.
Forecaster notes
The forecaster notes panel shows the notes other forecaster have created regarding their previous forecasts for the forecast point. Forecasters can also created their own note and publish them. The display is located at the bottom of the Explorer. All fields in this display can be filtered by clicking the cells.
...