
This is a draft page
Introduction
This tool calculates the yearly siltation inside the harbour basin based on the theory of Van Rijn
(Harbour siltation and control measures, 2012). The tool uses tidal characteristics (mean high water MHW, mean low water MLW and ebb/flood flow velocities)
and harbour characteristics (Total surface area, entrance width and entrance configuration) to calculate the exchanged volumes of water and suspended sediment,
variable concentrations and the yearly sedimentation within the harbour basin.
...
Measurements from reference projects reported in Van Rijn , (2012) show the following typical range of yearly siltation (m sediment thickness):
Salt/brakish conditions | Lower range | Upper range |
Harbour basin | 1.0 m | 2.0 m |
Harbour entrance | 2.0 m | 5.0 m |
Fresh conditions | Lower range | Upper range |
Harbour basin | 0.3 m | 0.4 m |
Harbour entrance | 1.0 m | 3.0 m |
...
How to use the tool
- Open a new project
- Start in Generic Data by defining a Bathymetry or Coastline in combination with a Cross-shore profile (slope), a Wave climate, Vertical and Horizontal Tidal characteristics and sediment characteristics
Please note: Only the wave climate and not the extreme wave climate is considered in the calculation. - Under “Structures”, draw a polygon element of type “Harbour Basin” covering the complete wet area of the harbour in open connection with the sea

- Open the Harbour Siltation tool
- Provide input according to the user input field descriptions below.
The horizontal eddy exchange volume depends strongly on the shape of the harbour entrance compared to the tidal flow direction/velocity. This factor needs to be given by the user (default = 0.03). The figure below helps to define this factor.
- Press the 'play' button to start the Harbour Siltation calculation
- After the calculation, four subwindows are shown below the map which hold the following information:
- Tidal conditions outside of harbour
This plot shows the Tidal water level [cm+MSL] and the Tidal Current Velocity [cm/s] over 2 tidal periods. Time series of tidal water level and current velocity are based on the input data from Generic Data: tidal water level based on “MHW” and “MLW” and tidal current velocity based on “Maximum ebb flow” and “Maximum flood flow”. The input “Phase difference tidal level-flow” will define the time difference in phasing.
- Exchange volume through entrance
This plot shows the total exchange flow through the entrance of the harbour during two tidal cycles. It presents the total exchange due to changes in tidal water levels (dark blue), the exchange volumes due to horizontal eddies caused by tidal flow along the harbour entrance (blue) and the additional exchange caused by salinity differences outside-inside (light blue). The latter two exchange volumes are only presented in positive values.
- Concentration inside harbour
This plot shows the average suspended sediment concentration outside and inside the harbour over the duration of 2 tidal cycles.
- Output properties
This panel shows a summary of the input parameters and total tidal exchange volumes in combination with total yearly sedimentation layer thickness and sedimentation volume. The last column presents the results from the sensitivity analysis for each of the included parameters. A comparison of the thickness of the final sedimentation layer and yearly sedimentation volumes are presented here.
- Tidal conditions outside of harbour
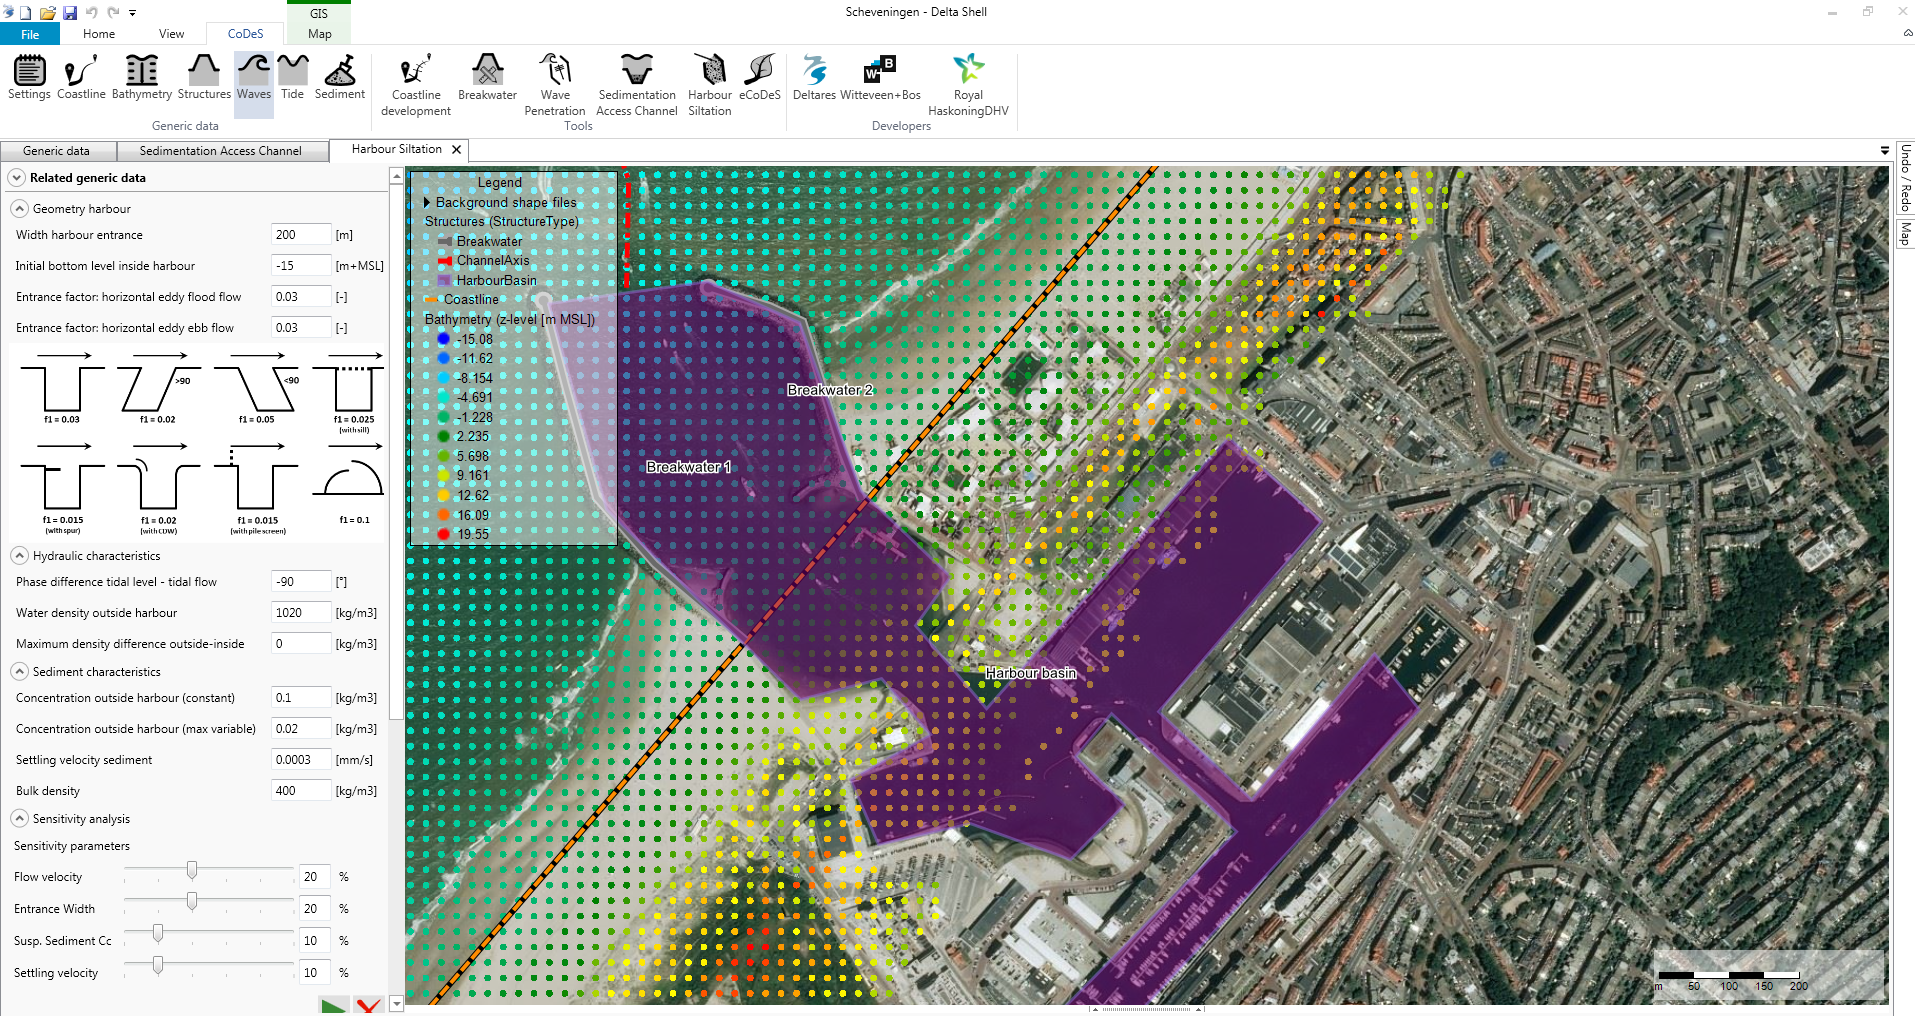
User input fields
A number of user input fields are provided which can be used to adjust the calculation according to the local situation. Default values are provided for each input field. The following inputs are defined:
Geometry harbour
| Default Value | Unit | Min. | Max. | Brief Description |
Width harbour entrance | 200 | m | 0 | 1000 | Width of the harbour entrance (distance between breakwaters). |
Initial bottom level inside harbour | -15 | m+MSL | -50 | -0.5 | Level of bottom of harbour (constant). |
Entrance factor: horizontal eddy flood flow | 0.03 | - | 0 | 0.25 | Entrance factor inducing horizontal eddy during flood flow. |
Entrance factor: horizontal eddy ebb flow | 0.03 | - | 0 | 0.25 | Entrance factor inducing horizontal eddy during ebb flow. |
Hydraulic characteristics
Text
Examples
Text
| Default Value | Unit | Min. | Max. | Brief Description |
Phase difference tidal level-flow | -90 | ° | -360 | 360 | Phase difference in tidal level versus tidal flow. In case of 0° flow velocity is peaking together with the maximum water level. |
Water density outside harbour | 1020 | kg/m3 | 500 | 2000 | Density of water outside harbour. |
Maximum density difference outside-inside | 0 | kg/m3 | 0 | 100 | Maximum density difference between outside and inside the harbour. Water density inside harbour will be lowered with this value. |
Sediment characteristics
| Default Value | Unit | Min. | Max. | Brief Description |
Concentration outside harbour (constant) | 0.1 | kg/m3 | 0 | 10 | Constant mud concentration outside harbour |
Concentration outside harbour (max variable) | 0.02 | kg/m3 | 0 | 10 | Maximum variable mud concentration outside harbour |
Settling velocity sediment | 0.0003 | kg/m3 | 0 | 1 | Settling velocity of suspended sediment (silt/clay) |
Bulk density | 400 | kg/m3 | 0 | 3000 | Bulk density after sedimentation of sediment (silt/clay) |
Sensitivity Analysis
| Default Value | Unit | Min. | Max. | Brief Description |
Sensitivity parameter: Flow velocity | 0 | % | 0 | 50 | Possible change or uncertainty in Flow velocity |
Sensitivity parameter: Entrance Width | 0 | % | 0 | 50 | Possible change or uncertainty in Entrance width harbour |
Sensitivity parameter: Susp. Sediment Concentration | 0 | % | 0 | 50 | Possible change or uncertainty in Suspended Sediment Concentration |
Sensitivity parameter: Settling velocity | 0 | % | 0 | 50 | Possible change or uncertainty in Settling velocity sediment |
Tool limitations
The main limitation of this tool is that both hydrodynamics and harbour are strongy simplified. Simplifying the harbour to one unit results into an average concentration and average sedimentation over the complete area of the harbour. Both concentration and sedimentation will differ significantly over the total harbour.
Example cases
The following files (.dsproj) can be downloaded and loaded into CoDeS to serve as examples. They are not based on actual projects, but are intended as illustration.
Unzip the files to an convient folder (but make sure the file structure does not change), and open the .dsproj file from within CoDeS.
| View file | ||||
|---|---|---|---|---|
|
More information will follow