...
Since release 2007.02, the display offers also the opportunity to show longitudinal profiles. In such graph, the parameter values (Y-axis) are plotted against the river chainage (X-axis). The graph can progress over time, eitehr step by step or animated, via the time control toolbar, described in the Spatial display. both the graph and table will change over time as they shown data along the profile. 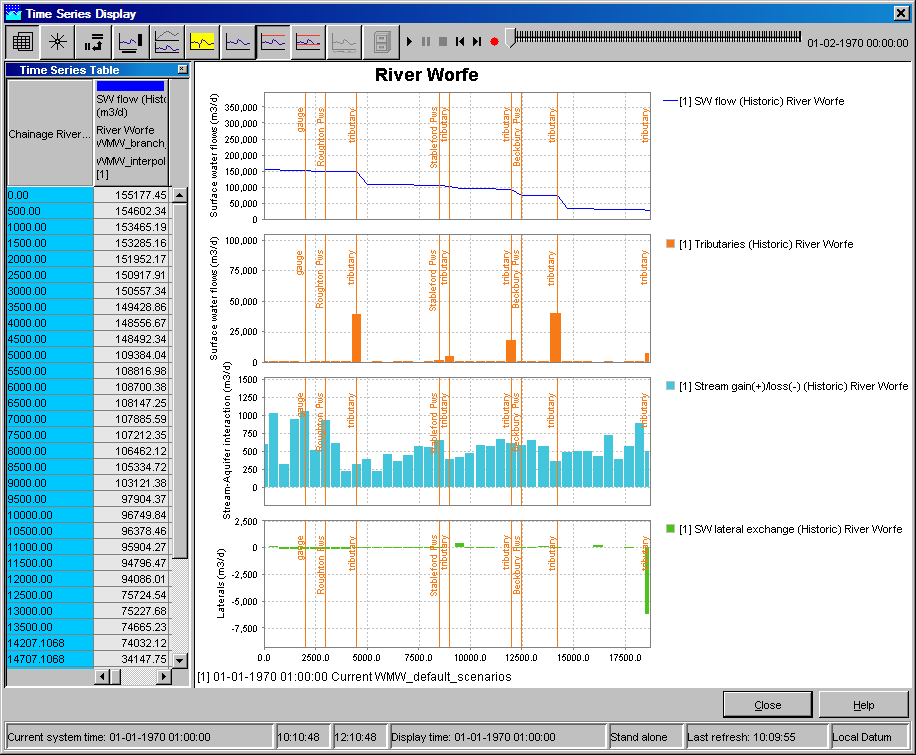
Rating curve

Category plot
| Note |
|---|
This graph type is available in DELFT-FEWS versions 2011.01 and higher. |
...