...
The display offers also the opportunity to show rating curves. In such graph, the rating curve stage values are plotted against discharge values. By default stage is shown on the Y-axis and discharge on the X-axis. Configure stageAxisOrientation ‘horizontal’ in TimeSeriesDisplay config if the axes should be switched. Rating curve display shows the rating curve that belongs to the location selected in the table or in the chart legend. If this location has multiple rating curves with different qualifiers, rating display shows a list where the specific rating curve can be selected

Displaying observations along with the rating curves
Since release 2019.02 it is possible to display observations along with the rating curve.To show the observations in rating curve display, follow these steps:
open TimeSeriesDialog with the time series you want to see along with the rating curve,
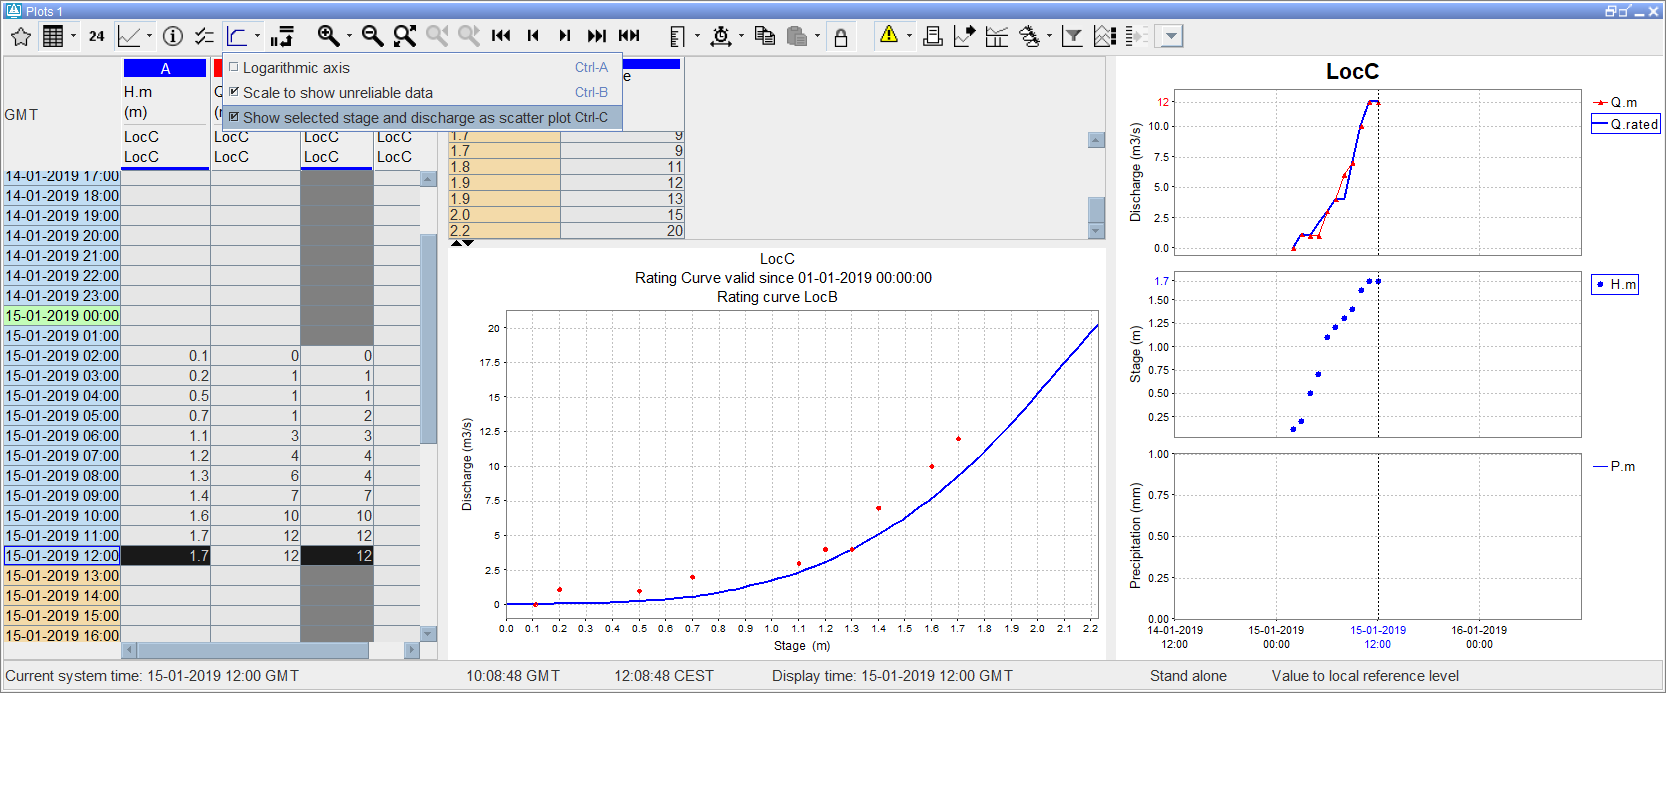
open rating curve display for required location,
select option “Show selected stage and discharge as scatter plot” from the drop down menu of the button “ Rating Curves” (on the TSD toolbar),
select one stage series and one discharge series from the time series table or from the chart legend. The selected series will be shown as scatter plot along the rating curve. All values in the chart zoom period will be displayed. The number of values shown can be changed by changing of the zoom period.
Note that the selected series must be stage and discharge, it means the series parameter must be from the same parameter group as the rating curve parameters configured in Parameters.xml. Other series selection will be ignored.
Category plot
| Note |
|---|
This graph type is available in DELFT-FEWS versions 2011.01 and higher. |
...