...
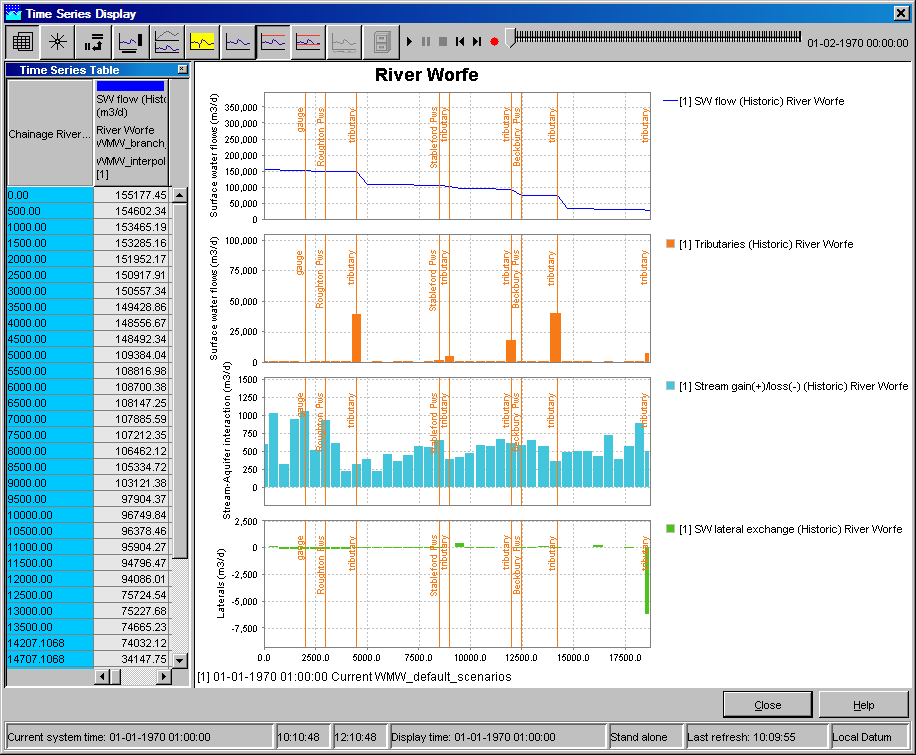
Since release 2007.02, the display offers also the opportunity to show longitudinal profiles. In such graph, the parameter values (Y-axis) are plotted against the river chainage (X-axis). The graph can progress over time, eitehr step by step or animated, via the time control toolbar, described in the Spatial display. both the graph and table will change over time as they shown data along the profile.
Longitudinal profiles can be simply added to the display by configuration of timeSeriesSet’s with value type longitudinalprofile in the config file DisplayGroups.xml
Rating curve
The display offers also the opportunity to show rating curves. In such graph, the rating curve stage values are plotted against discharge values. By default stage is shown on the Y-axis and discharge on the X-axis. Configure stageAxisOrientation ‘horizontal’ in TimeSeriesDisplay config if the axes should be switched. Rating curve display shows the rating curve that belongs to the location selected in the table or in the chart legend. If this location has multiple rating curves with different qualifiers, rating display shows a list where the specific rating curve can be selected
...