...
The lines are displayed under the data points. The colours correspond with the colouring used in the tables.
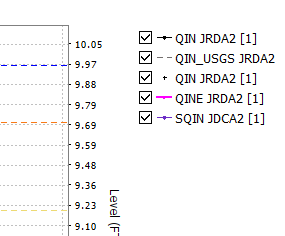
![]() Show on/off checkboxes in legend (since 2020.02)
Show on/off checkboxes in legend (since 2020.02)
It is possible to show checkboxes in the legend to quickly hide/unhide time series in the time series dialog. You can find the option to show legend checkboxes in the chart dropdown button in the toolbar.
 Statistical Functions
If switched on in the configuration. This functionality works independently from the descriptive statistics table.
...