...
When data series of different data types have been selected, the data will be presented in different subplots with the data series of a single data type merged into one subplot.
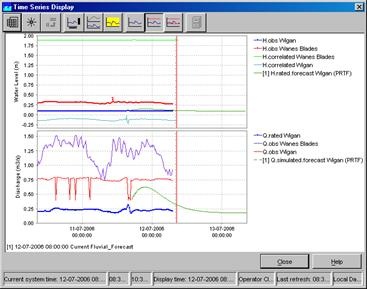

The data in the graph is updated automatically in case new data becomes available. Below the graph the workflows are listed that generated the forecast time series in the graph. Their numbers are used in the graph legend and table headers too.
...
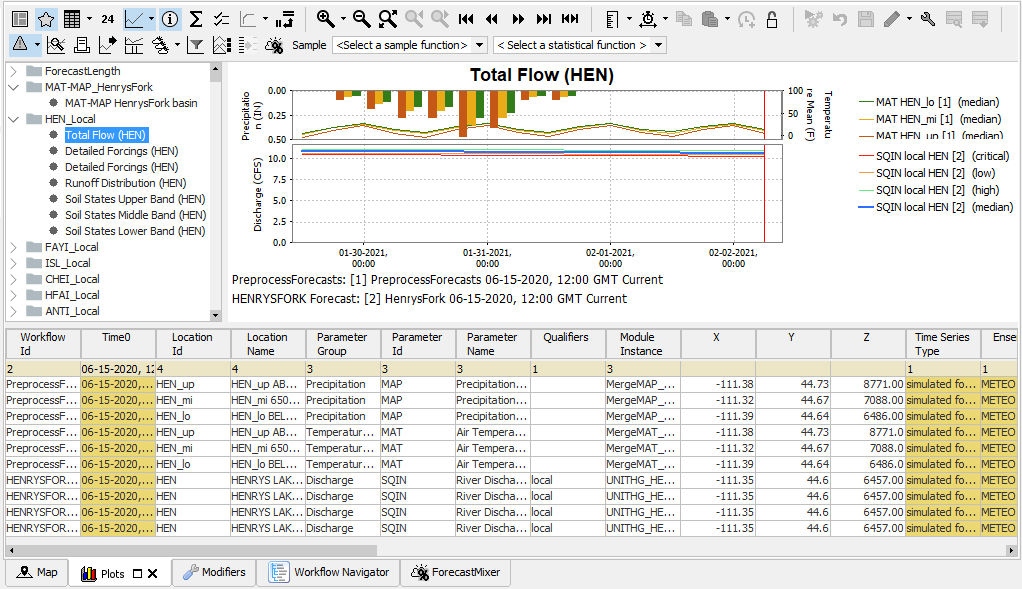
By clicking this button the time series in the graph is also displayed in tabular format. Please note that in case you like to edit data, you have to select the Data Editor from the Tools menu (see section 4.3).


Selecting the small arrow at the right of the icon shows the next menu:

| function | description |
|---|---|
| Validation | shows a separate column with the validation flags |
| Users | shows a separate column with the user names of editted values |
| Comments | shows a separate column with the comments |
| Units | shows in the header the unit of the parameter |
| Location Names | shows in the header the location name |
| Location Ids | shows in the header the location ID |
| Module | shows in the header the moduleInstanceId |
| Column statistics | shows between the header and the table statistics of the values in the current relativeViewPeriod, like mean, sum, min, max |
| Threshold crossing | shows in the cells (on the left side) a small bar with a color according to the threshold definition, that indicates a threshold crossing |
| Normal | shows the values in a normal table, so all times have a row |
| Days | shows the values in an aggregated way, so that each day gets its own column. Usefull to series with for example an hourly time step. |
| Weeks | shows the values in an aggregated way, so that each week gets its own column. Usefull to series with for example a daily time step. |
| Months | shows the values in an aggregated way, so that each month gets its own column. Usefull to series with for example daily time step. |
| Years | shows the values in an aggregated way, so that each year gets its own column. Usefull to series with for example monthly time step. |
| Removed times | Show the deleted time steps from non-equidistant time steps. |
| Time order reversed | Shows the times in reversed order, so from new to old |
...
The data shown via the Shortcuts belong to the forecasts selected in the Forecasts panel of the FEWS Explorer. Please note that the current forecast is always displayed in the graphs.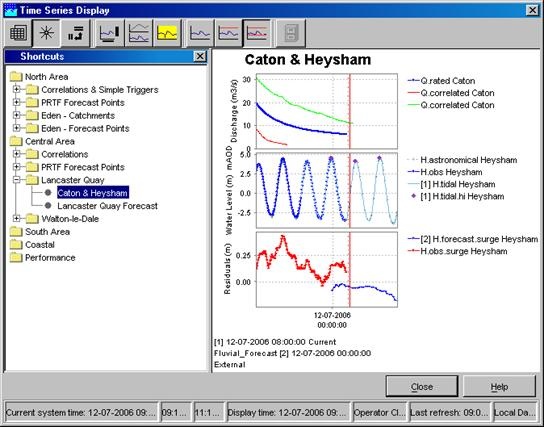

 Graph
Graph
This button can be used to hide or show the graph. If the table was not yet selected, it will show up.
Selecting the small arrow at the right of the icon shows the next menu:


...
 Timeseries Lister
This button will add below the display a database viewer of the timeseries that are displayed. The database records are visualised as individual rows, which can be selected. When selected it can be browsed through (all columns). All meta information and statistics are calculated on-the-fly and are not stored. Within selections or filters (e.g. on start/end time) the content of the (visible) columns are updated immediately. There are many columns which can be viewed: general columns about module instance, location, parameter, disk space and all kind of relevant meta information about the selected record(s).
Besides the 'general' metadata, the basic statistics of that row can be inspected. These basic statistics are sum, average, maximum, minimum, etc. The remaining columns describe the quality of the data. If the user e.g. wants to know how many values are 'unreliable' and how many 'periods' of unreliable data are available, this information can be retrieved. The same is true for all kinds of combinations of doubtful, completed and corrected data. This same functionality (number of records, periods) is available for primary and secondary validation results. This means that the user can inspect number of records and periods of e.g. hard maximums and flag comparison or series comparison.
The Timeseries Lister has similar functionality as the Database Viewer, like filtering, ordering and righmouse context menu options. These are described in detail in: Database Viewer
 Descriptive statistics
This button will add a table to the display with descriptive statistical information. The statistics only appear if a column in the table is selected. Use the right mouse button to copy this a table to the display with descriptive statistical information. The statistics only appear if a column in the table is selected. Use the right mouse button to copy this table to the clipboard for pasting in Excel.
...
- Number of values
- Number of completed values
- Number of corrected values
- Number of doubtful values
- Number of missing values
- Number of reliable values
- Number of unreliable values
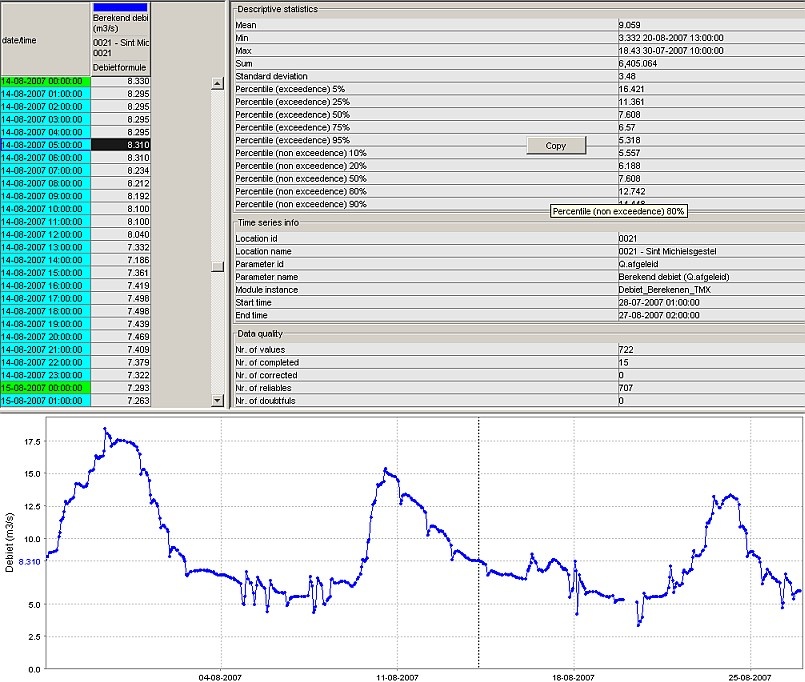


...
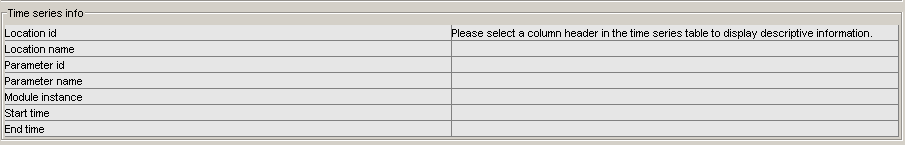
Timeseries Information (hidable panel)
Since 2016.02 button is added to show (or hide) a panel that show the validation criteria shows a panel with four subpanels (toggleable) with the Timeseries Information, Attributes, Validation criteria and availabel Thresholds for the selected time series on the selected time step


Opening this panel will automatically hide descriptive statistics panel when open
Changing the view period
![]()
Since 2020.01 it is possible to move the view period to the first or to the last data point available. This will not change the zoom in the display. The buttons are in the following order:
...