...
It will open a zoomed out graph were a smaller period can be selected via the black vertical lines. The red vertical line shows the display time and the green vertical line the system time.

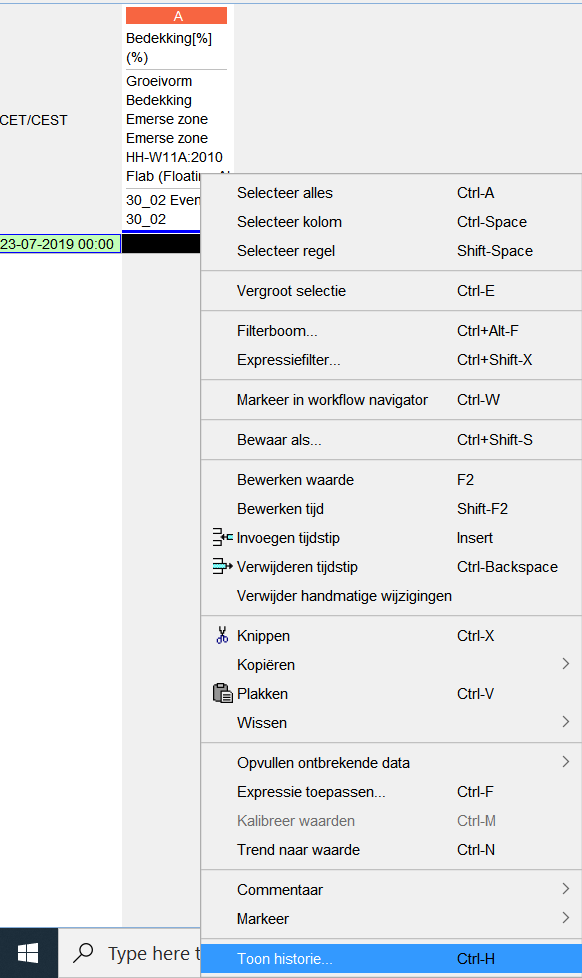
History popup
When clicking ctrl+H on a value, a popup will appear which shows the history of data on that time step.