...
Toggling off a checkbox will only hide the individual time series. If you toggle off all time series in a chart or subplot, the plot will still show an empty chart. This is by design so that the checkboxes still indicate which time series can be toggled back on. To hide an entire chart or subplot, you should use the TimeSeries Visibility Dialog with the legend checkboxes disabled.
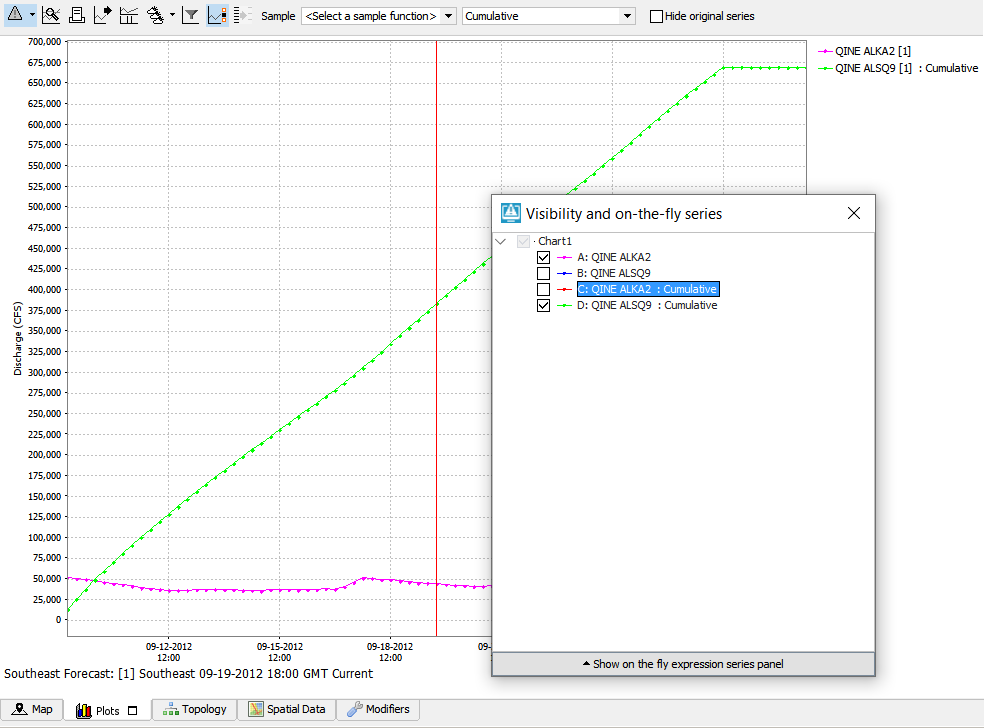
When statistical series are active, it is possible to also hide them individually. The same applies to their source series, they can be hidden without the resulting statistical series being hidden.
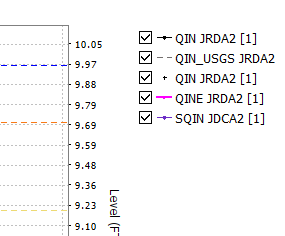
When checkboxes are not shown in the legend the hidden series will not be in the legend.
But when checkboxes are shown in the legend, their will be an empty checkbox for the series just like in the visibility dialog.

When "hide original series" is selected for the statistical functions, the sources series for the statistics will not be shown in the graph, table, visibility dialog and legend (with or without checkboxes)
The same applies for resampled series, when "show original series" is not selected, the sources series for the resampled series will not be shown in the graph, table, visibility dialog and legend (with or without checkboxes)

 Statistical Functions
If switched on in the configuration. This functionality works independently from the descriptive statistics table.
...