...
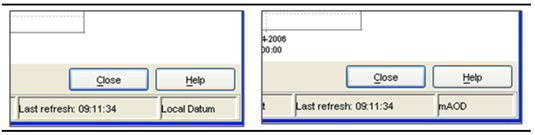
The Datum Toggle at the lower right hand corner of the display allows levels to be displayed with reference to Local Datum or mAOD .
Seamless integration
Navigating in Graphs
Zooming in and out can be done with help of the scroll wheel of the mouse. Scrolling away from the user results in zooming in while scrolling towards the user results in zooming out.
...
A small pop-up window shows that you can now shift the historic event forwards and backwards by pressing the "+" or "-" keys on your keyboard. When the shift procedure is completed press [Done ].
Seamless integration
Seamless integration automatically augments the data record through on-the-fly downloads from the OpenAchive.
First press the button “Connect to the external data source”. Fews starts looking for the data, relevant for the plot, in the Open Archive:

When any relevant data is found, the button “Read data from the external data source” becomes enabled :
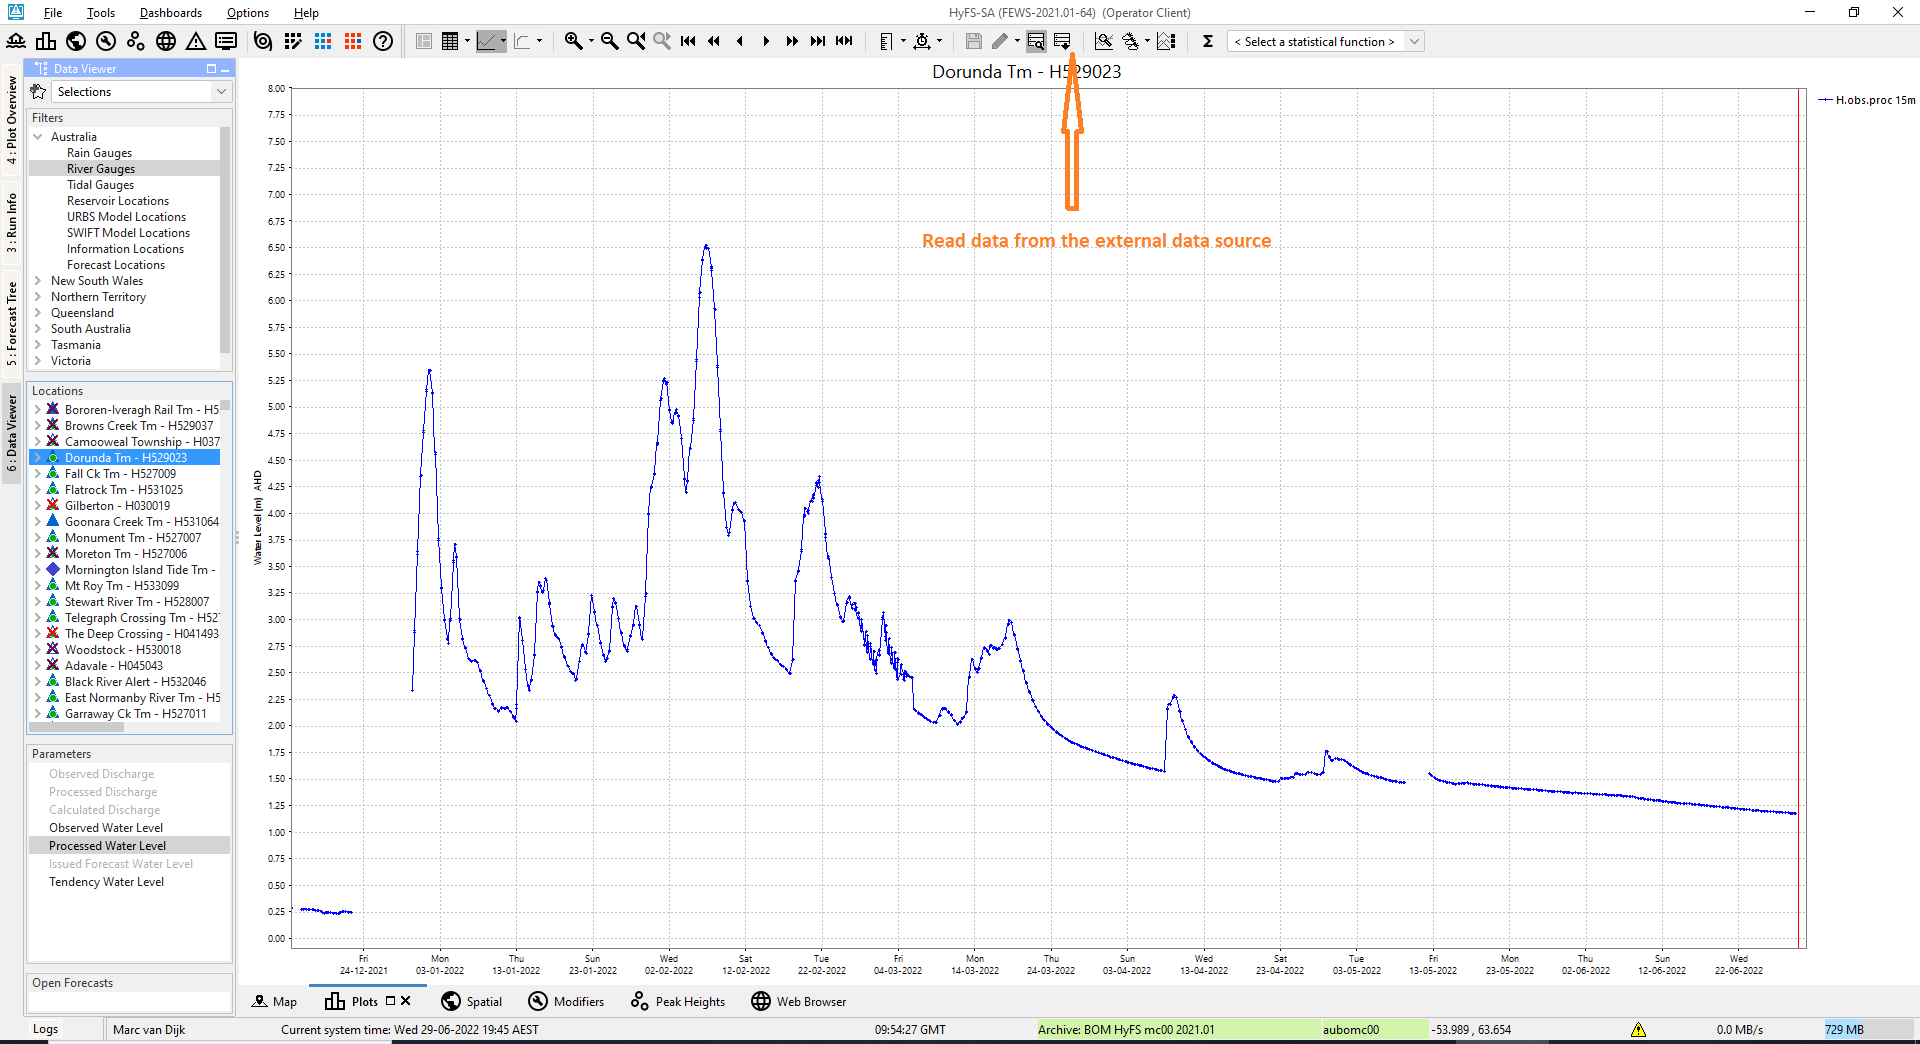
Press the button “Read data from the external data source”, and the data will be read and shown in the plot :

Longitudinal profile
Since release 2007.02, the display offers also the opportunity to show longitudinal profiles. In such graph, the parameter values (Y-axis) are plotted against the river chainage (X-axis). The graph can progress over time, eitehr step by step or animated, via the time control toolbar, described in the Spatial display. both the graph and table will change over time as they shown data along the profile.
...